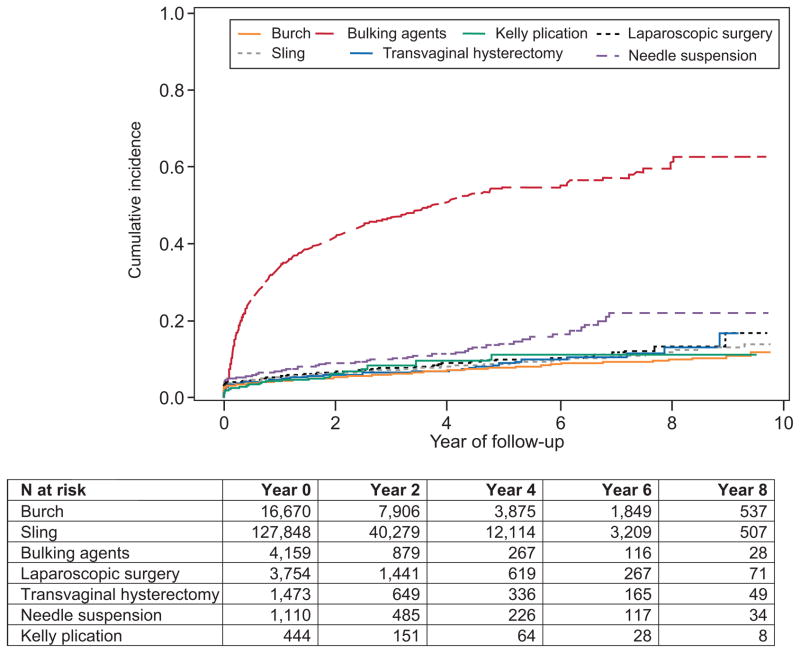
Fig. 1.
Kaplan-Meier survival curve after index stress urinary incontinence (SUI) surgery. This survival curve depicts the cumulative incidence of repeat SUI surgery after each type of procedure, and there is a statistically significant difference among the groups (P<.001). The table lists the at-risk number remaining at the beginning (year 0) as well as at years 2, 4, 6, and 8.

