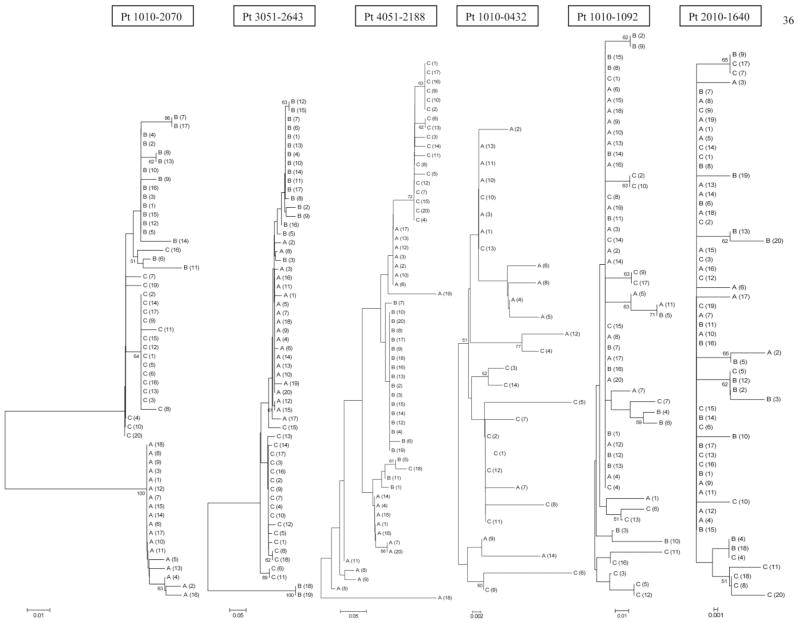
Fig. 2.
Phylogenetic reconstruction of evolutionary relationship of HVR1/E2 sequences in 6 patients. Bootstrap proportions of greater than 50% are shown at branch points. The taxa are labeled A, B, and C indicating sequential samples from each patient, which correspond to visit numbers shown in Fig. 1. In patients 1010-0432, 1010-1092, and 2010-1640 viral population was relatively monophyletic with intermingling of sequences from different visits, while in patients 1010-2070, 3051-2643, and 4051-2188 quasispecies from sequential visits tended to group separately.

