
Fig. 5.
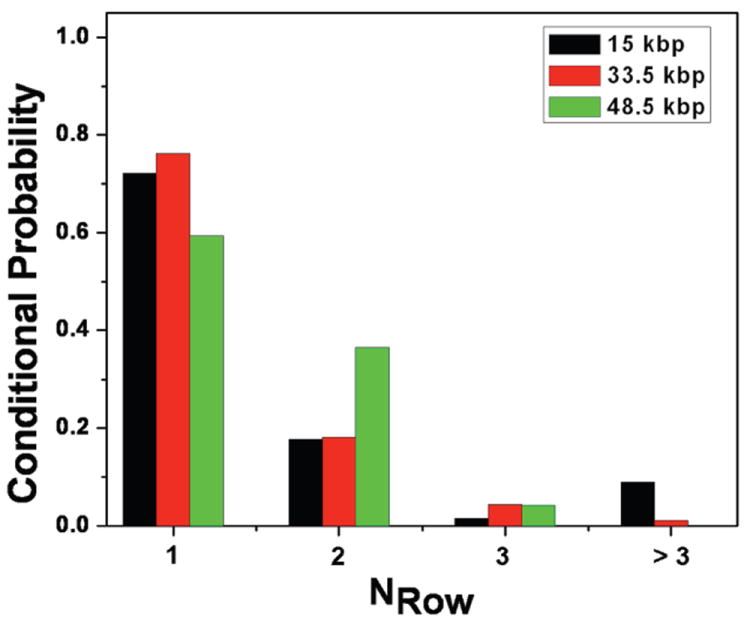
Probability distribution for the collision at a given row conditioned on colliding with the first nanofence in the viewing area. The histogram shows the probability of a DNA molecule that collides with the first fence to make its next collision with the 2nd fence (NRow = 1), 3rd fence (NRow = 2), 4th fence (NRow = 3), or some later fence (NRow > 3) outside of the viewing area. The experiments were carried out at an electric field of 10 V/cm.