
Fig. 6.
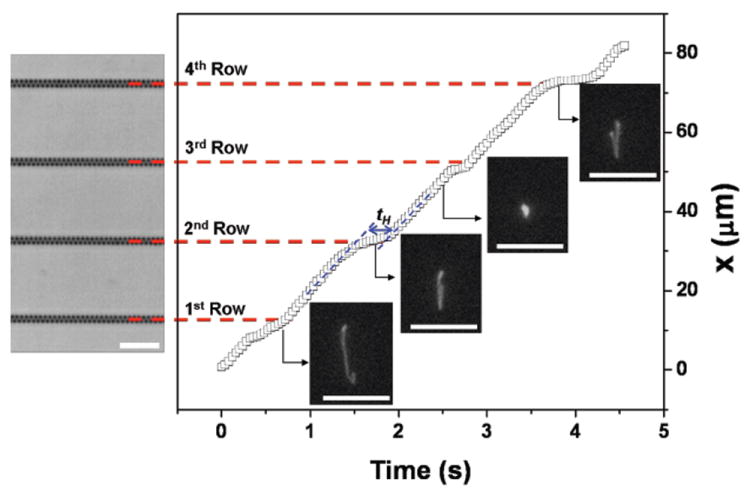
Trajectory of the center of mass of a 33.5 kbp DNA at 10 V/cm. There are four nanofences in the viewing window of 82.7 μm. Four images of a 33.5 kbp DNA during migration in the nanofence array are included, with the direction of motion being from bottom-to-top (corresponding to the bright field image). The DNA moves at constant free solution migration velocity before and after collisions (blue dotted lines). Scale bars = 10 μm.