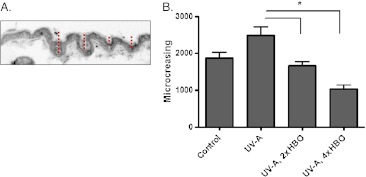
Fig. 5.
Skin micro-creasing. a Skin micro-creasing was quantified by measuring the depths of folds on microscopic sections. The red bars show an example of such a measurement on a tissue section. b Images obtained from all treatment groups were quantified for micro-creasing. An equal number of images and animals were analyzed for each group (n = 8). Depth measurements were summed to obtain the total micro-creasing value, which is shown in the graph (*p < 0.01 and 0.001 for the 2× HBO and 4× HBO groups, respectively, as determined by ANOVA and Tukey’s multiple comparisons test)

