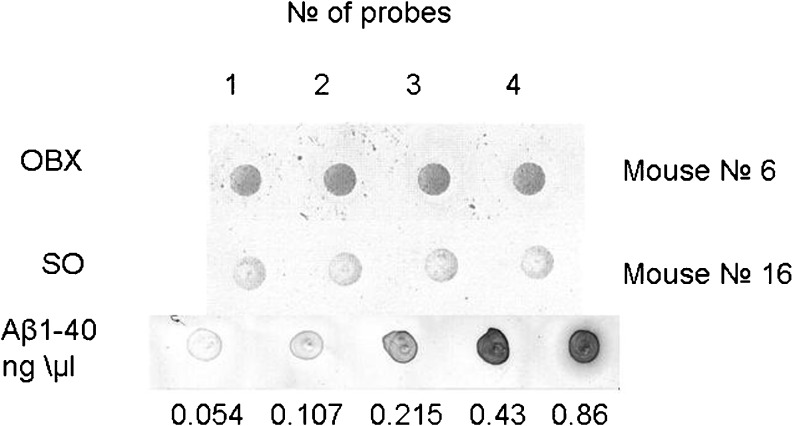
Fig. 3.
The levels of Aβ in OBX and SO mice as revealed by DOT blot analysis. The two upper rows depict representative dot blots from an OBX mouse and SO mouse correspondingly. Four samples (dots) were taken from each mouse for the analysis. The bottom row represents the calibration of the Aβ quantity

