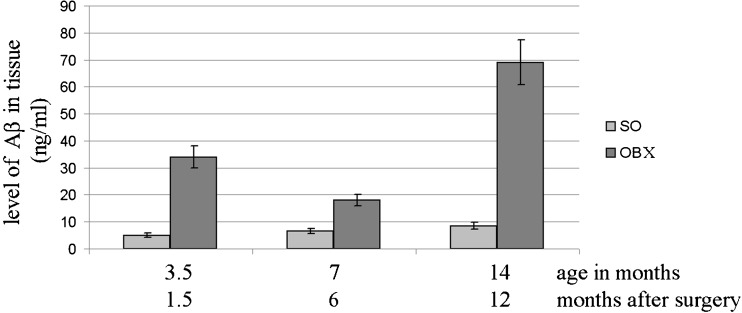
Fig. 5.
Age-dependent fluctuations in Aβ levels in hippocampus of SO and OBX mice. Bars indicate the level of Aβ peptides (mean ± SEM) in the groups of experimental mice (n = 6–11 per group). Aβ was determined by DOT analysis (see “Materials and methods”). Differences between the levels of Aβ were determined by using the two-tailed Student’s t test in the SO and OBX groups at different age and time intervals after the surgery

