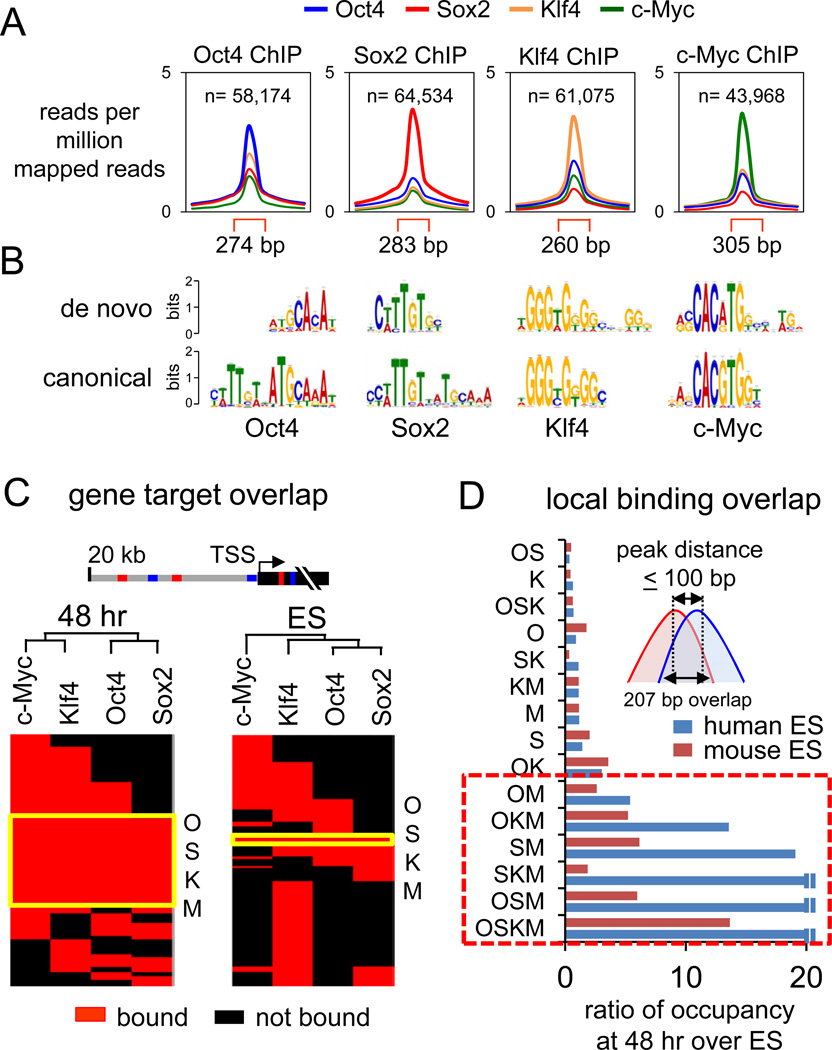
Figure 1. Extensive OSKM engagement with the genome at 48 hr post-induction.
(A) O, S, K, and M peak profiles showing average read counts, input subtracted, lane-normalized, and as reads per million mapped reads. Read counts within peak regions (red brackets) are compared to 1 kb flanking regions. See Figures S1, S2, and Table S1 for ChIP-seq details and peak examples.
(B) De novo sequence motifs overrepresented in the O, S, K, and M peaks compared to their canonical motifs found in the JASPAR database (Bryne et al., 2008).
(C) Hierarchical clustering of O, S, K, and/or M co-bound target genes in 48 hr (left) and in ES cells (right). Genes are called OSKM-targets if bound within the gene body or 20 kb upstream and are shown as red rectangles and non-targets as black rectangles. The genes co-targeted by all OSKM factors are indicated in the yellow boxed region, “OSKM”.
(D) OSKM co-bound regions at 48 hr with peak distances ≤100 bp are more frequent compared to those found in human ES (blue bars) (Lister et al., 2009) and mouse ES (red bars) (Chen et al., 2008). The O, S, K, and/or M co-bound regions are expressed as ratio of that seen at 48 hr to that seen in ES cells. Boxed area indicates extensive co-binding of c-Myc with O, S, and/or K.
See also Figures S1, S3, and Table S3.

