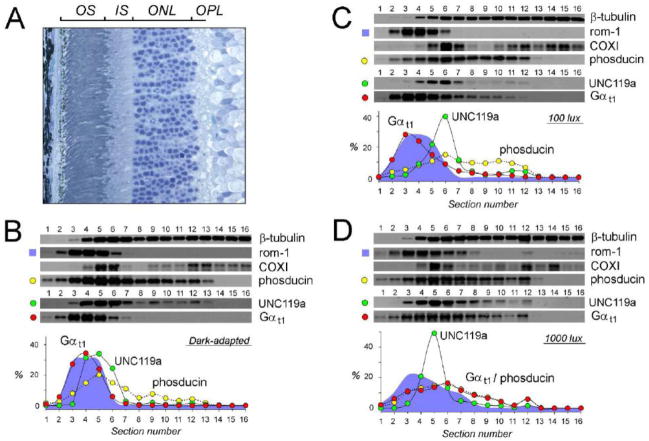
Figure 2. Analysis of the distribution of UNC119a and Gαt1 by Western blotting of serial sections of the retina.
(A) Cross-section of rat retina stained with toluidine blue, retina layers abbreviated as in Fig. 1. (B–D) Retinas were obtained from either dark adapted rat (B) or rat exposed to 100 lux (C), or 1000 lux (D) light for 45 min, flat mounted, frozen and serially 10 μm sectioned (1–16). Each section was dissolved in SDS sample buffer, and analyzed by Western blotting with antibodies against the proteins indicated next to each blot. Plots show quantification of UNC119a (green), and Gαt1 (red), phosducin (yellow), and rom-1 (cyan) distribution in the blots: the fluorescence value of a specific band in each section on the corresponding blot was plotted as a percentage of the total fluorescence value of all bands in all sections on the blots.

