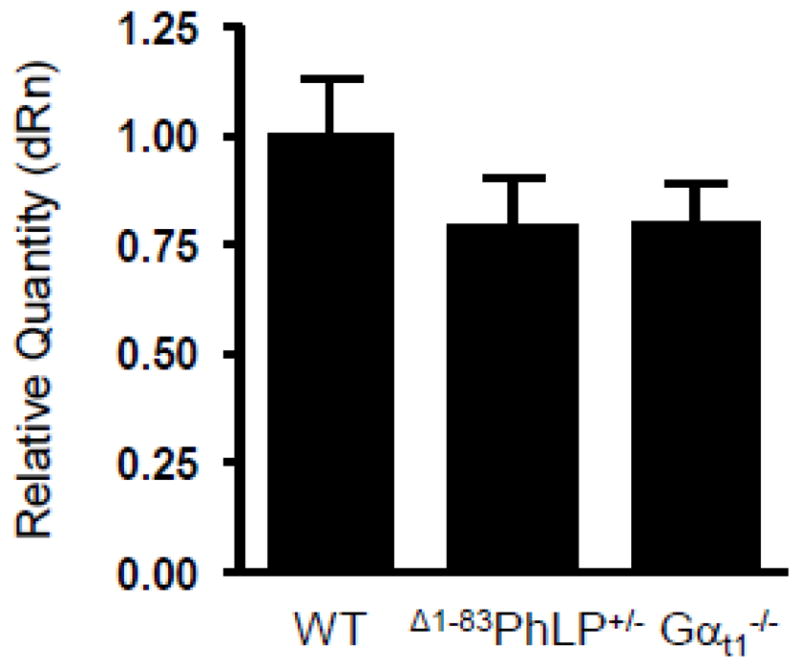
Figure 5. Normal levels of UNC119 transcript in the retinas lacking Gαt1 expression.

The levels of UNC119a transcript in the retinas of 10 days-old Δ1−83PhLP−/− (WT), Δ1−83PhLP+/−, and Gαt1−/− mice were determined by quantitative real-time PCR. The mean of three independent measurements in Δ1−83PhLP+/− and Gαt1−/− mice was normalized to that in Δ1−83 PhLP−/− mice regarded as a wild-type control.
