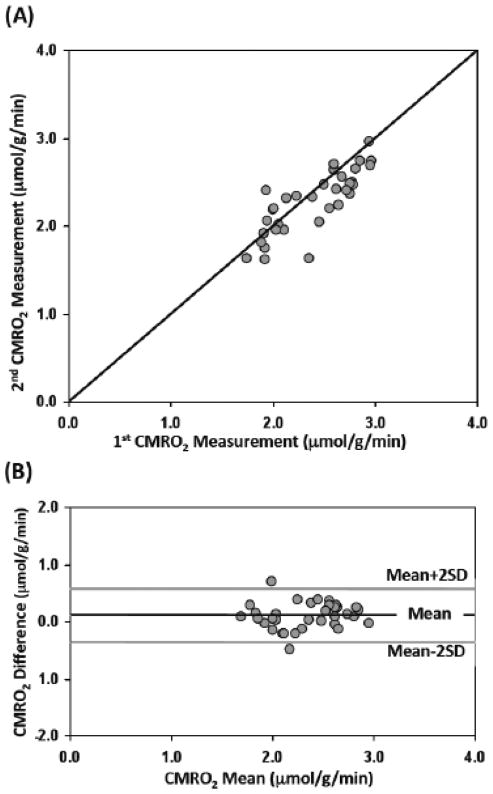
Figure 3.
Comparison of two repeated CMRO2 imaging measurements in the same MCAO mouse. (A) The relationship between the 1st and 2nd CMRO2 measurements across multiple CSI voxels (n=34) with a line of equality. (B) The Bland-Altman plot of the differences verse the mean values between the two repeated CMRO2 measurements. The black line depicts the mean (0.11 μmol/g/min) of the difference between the two CMRO2 measurements and the gray lines defines the limits of agreement where 95% of the difference values are expected to be less than two standard deviation (SD=0.23 μmol/g/min).

