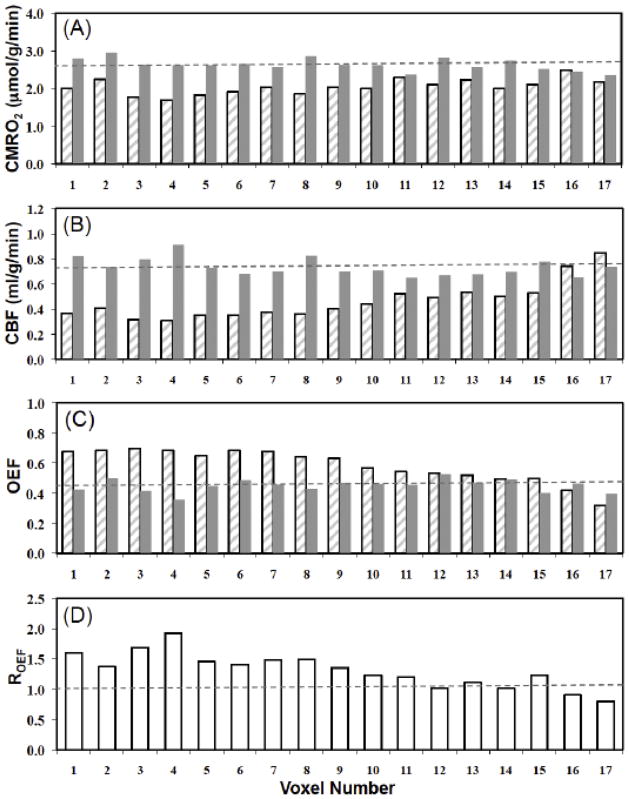
Figure 6.
Comparison results of CMRO2, CBF, OEF and OEF ratios among the paired image voxels in the MCAO affected hemisphere (hatched bars) and contralateral, intact hemisphere (gray bars) obtained from a representative MCAO mouse brain. Voxel wise comparison of (A) CMRO2 values, (B) CBF values and (C) OEF values between MCAO affected and normal hemispheres. (D) OEF ratios between OEFI and OEFC. The dashed lines represent mean values of the physiological parameters in the intact hemisphere.

