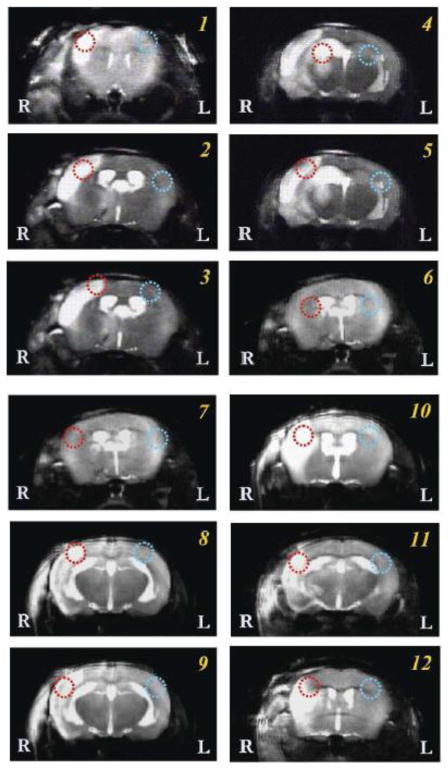
Figure 7.
T2-weighted 1H MR images of all animals scanned in this study. Single or multiple image slices selected from each mouse were displayed with one pair of 17O CSI voxels identified on each image as red and blue circles. The red circles indicate the voxel located in the typical MCA occluded brain regions; and the corresponding blue circles were in the symmetric location of the contralateral hemisphere with intact brain tissue.

