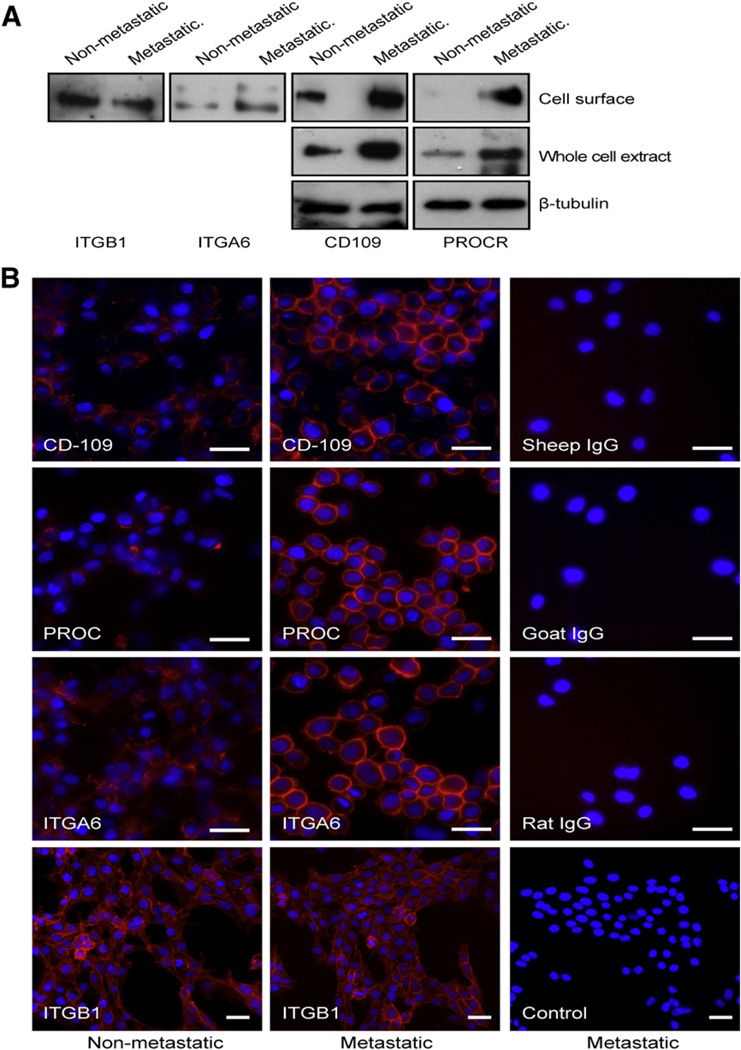
Fig. 3.
Validation of the quantitative differences in the non-metastatic and metastatic cells. A. Expression of CD109, PROCR, ITGA6, and ITGB1 in the metastatic and non-metastatic cells was detected using the Western blot analysis of cell surface extracts. Expression of CD109 and PROCR was also analyzed in the whole cell extracts. Beta-tubulin was used as a loading control for the whole cell extracts. B. Visualization of the cell surface of non-fixed, live non-metastatic and metastatic cells with immunofluorescence using antibodies against CD109, PROCR, ITGA6 and ITGB1 followed by an Alexa-594 conjugated secondary antibody. Metastatic cells showed higher expression of CD109, PROCR, and ITGA6 (red) on their surface than the non-metastatic cells while no difference was observed for ITGB1 between the cell lines. The appropriate control IgGs were used to show the background of the assay (panels in the right). Nuclei were visualized with DAPI (blue). Original magnification 400× (CD109, PROCR, and ITGA6, and their controls) and 200× (ITGB1 and its control). Scale bar 20 µm. Images were digitally cropped in Photoshop CS4. (For interpretation of the references to color in this figure legend, the reader is referred to the web version of this article.)

