Abstract
Port wine stain (PWS) birthmarks are one class of benign congenital vascular malformation. Laser therapy is the most successful treatment modality of PWS. Unfortunately, this approach has limited efficacy, with only 10% of patients experiencing complete blanching of the PWS. To address this problem, several research groups have developed technologies and methods designed to study treatment outcome and improve treatment efficacy. This paper reviews seven optical imaging techniques currently in use or under development to assess treatment efficacy, focusing on: Reflectance spectrophotometers/tristimulus colorimeters, Laser Doppler flowmetry (LDF) and Laser Doppler imaging (LDI), Cross-polarized diffuse reflectance color imaging system (CDR), Reflectance Confocal Microscopy (RCM), Optical Coherence Tomography (OCT), Spatial Frequency Domain Imaging (SFDI), and Laser Speckle Imaging (LSI).
Introduction
Port wine stain (PWS) birthmarks are progressive vascular malformations occurring in 0.3% to 0.5% of the population (1), They commonly occur on the head and face regions (2). Though incompletely understood, the most supported hypothesis for PWS development is a deficiency or absence of regulatory neurons controlling microvascular contractions, resulting in ectatic post-capillary vessels (3). In some aging patients, PWS lesions progressively darken in appearance, while becoming hypertrophic and nodular, resulting in further disfigurement.
Radiation therapy, freezing, surgical excision, and tattooing are amongst past treatments for PWS, yet laser therapy has proven most safe and successful due to its ability to destroy cutaneous vessels while avoiding significant damage to overlying tissues (4). Pulsed dye lasers (PDLs) causing selective microvascular damage commonly operates in the 577–600 nm wavelengths, though the 755 nm wavelength laser are used for mature and thicker PWS (5, 6) PDL therapy is the common approach for PWS birthmark treatment, but has important limitations in terms of success and risk (4) as only ~60% of patients experience reduction in size and redness of targeted PWS skin and after 10 treatment sessions, only ~10% of patients experience complete disappearance of the birthmark (7). Previous studies indicate that certain PWS skin characteristics, such as average epidermal thickness or depth of PWS upper boundary, are associated with treatment outcomes (5), but this remains unpredictable between individuals and even on multiple sites on the same patient.
We review several innovative optical technologies each of which attempts to improve the effectiveness of PWS treatment sessions with the potential to augment clinical impression using objective information. The rationale for development of these methods is that if developed to a sufficient degree and applied methodically, they have the potential to reduce the reduce the number of painful and costly procedures by providing objective feedback in order to mitigate the variability in treatment outcome that arises from variations in practitioner experience as well as differences between patients.
Optical methods are advantageous, being non-invasive, portable, and relatively inexpensive, with the potential to provide rapid feedback to the practitioner. In particular, hemoglobin and red blood cells, which are intimately related to PWS, have several features to which optics possess exquisite sensitivity.
1) Reflectance spectrophotometers and tristimulus colorimeters
Presence and degree of pre and post-treatment erythema is one of the widely used clinical indicators of PWS skin (8). Commercial devices, such as reflectance spectrophotometers and tristimulus colorimeters, provide quantitative measurements of erythema and melanin content in PWS skin.
Reflectance spectrophotometry is the most established and widely used technique for the objective assessment of PWS (9). Spectrophotometry generally entails the measurement of the wavelength dependent transmission properties of a particular material. A spectrometer is used on the detection end, to measure light over the visible and near-infrared portions of the electromagnetic spectrum (9).
Colorimetry generally entails the approaches associated with the science of describing human colour perception. Tristimulus colorimeters are often used in digital imaging in order to determine output of light sources by taking a limited number reading of output energy in few broad spectral bands in the visible spectrum (9). Alternatively, the tristimulus colorimeter illuminates skin with white light and detects reflected light with three filtered photodiodes sensitive to red, green, or blue (RGB) light (10–12). The RGB data is subsequently converted to saturation and light intensity, representing the degree of skin erythema (hemoglobin content) and the degree of skin pigmentation (melanin content), respectively (8). In a reflectance spectrophotometer used for skin characterization, light is emitted for the assessment of erythema and melanin content at green and red wavelengths, respectively (8). A photodetector senses the reflected light and a microprocessor computes the erythema and melanin indices.
Currently, spectrophotometric devices are employed for the study of PWS lesions. Generally these are used to objectively describe the complex effects of various skin chromophores on the overall perceived color of both normal and PWS skin. A recent review of spectrophotometric devices such as Tristimulus colorimeters suggests that by collecting spectroscopic data over two or three treatment sessions, one can use this data to predict the best possible clearance and the required number of treatment sessions for an individual patient (9). Interpretation of spectral reflectance data often relies on mathematical modeling, such as Monte Carlo methods (9). The choice of model can greatly affect the overall accuracy of data interpretation, which causes spectrophotometric devices to require considerable expertise in interpreting the complete dataset.
Tristimulus devices present results in color space, which is a way of describing a given color using a predetermined set of characteristics, or dimensions. This is simple to use and interpret and more sensitive to changes in redness (9). Tristimulus devices produce a direct measurement of skin color, but are limited due to errors associated with spectral surface reflectance and the effects of skin chromophores such as melanin, which interferes with quantitative assessment of hemoglobin (9).
2) Laser Doppler flowmetry
Laser Doppler flowmetry (LDF) is a noninvasive method of characterizing tissue perfusion. Commercially available since the early 1980s, LDF is an established technique for the real-time measurement of microvascular perfusion in tissue (13). Signals from the tissue are recorded in BPU (Blood Perfusion Units); a relative perfusion scale defined using a calibration standard comprised of a latex sphere suspension undergoing Brownian motion.
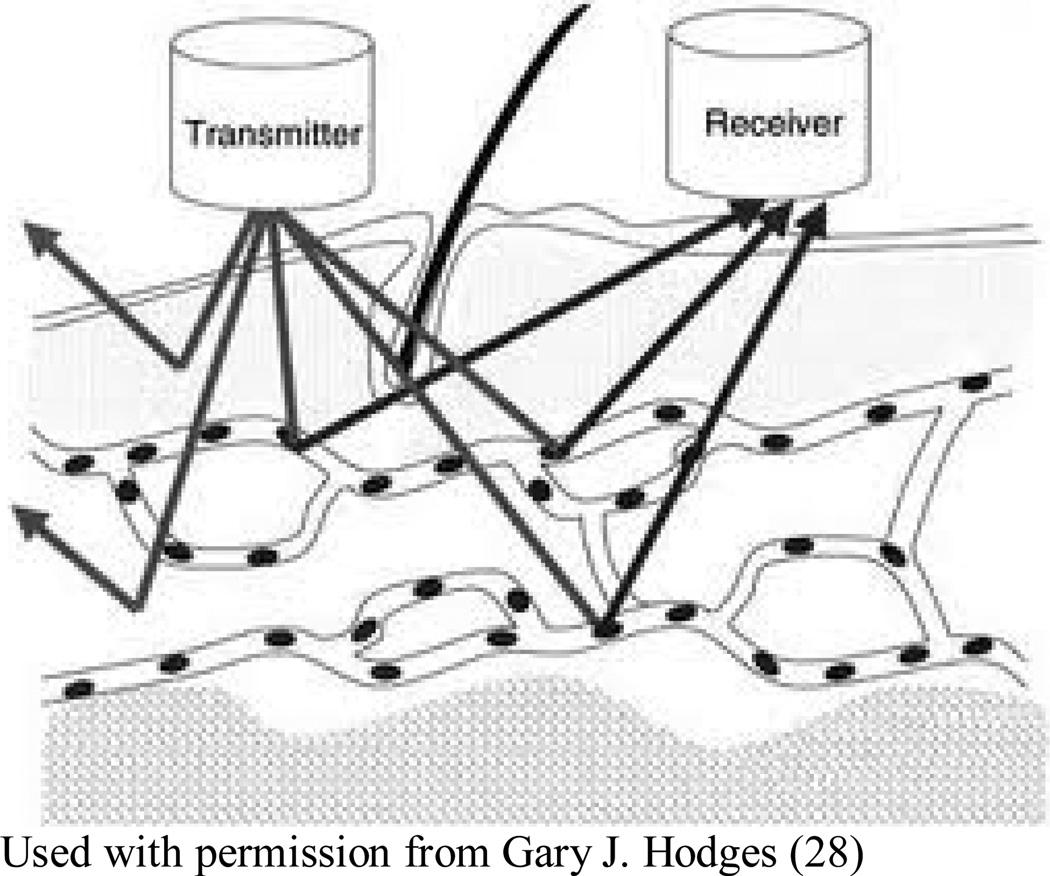
LDF illuminates tissue with low-power laser light from a probe containing optical fiber light guides. Laser light from one fiber is scattered within the tissue with some propagating back to the probe. A second optical fiber collects the backscattered light from the tissue and transmits it to a photodetector. Most of the detected light is scattered by stationary tissue components, but a fraction of the detected light is scattered by moving red blood cells, resulting in a small Doppler shift of the optical frequency. Signal processing algorithms are employed to extract the Doppler shift and to provide information on the degree of tissue perfusion.
The LDF technique has several advantages over other methods such as fluorescein angiography, or transcutaneous oxygen pressure (pO2) in the measurement of microvascular perfusion. Most importantly, since LDF is a non-invasive technique (unlike fluorescein angiography or transcutaneous oxygen pressure measurement), it is benign and noninterfering with normal physiological states of the microcirculation. The small dimensions (10 mm) of the LDF probes enable their employment in situations not readily accessible using other techniques.
LDF measurements are relative, and while proportional to perfusion, the factor of proportionality differs in varying tissues. LDF is limited by the need for mechanical scanning of the probe laser beam, resulting in minute long image acquisition times (14) for modest (i.e., 256×256) pixel dimensions, which increases the likelihood of image corruption by motion artifacts (13). LDF samples only the tissue directly beneath the contact probe, characterizing only a small fraction of the PWS vasculature per measurement. To assess the degree of photocoagulation in a practical manner, a critical need for a rapid vascular imaging platform exists.
Though Laser Doppler is an established tool in hospital burn wards, it has been used within the context of blood flow imaging in dermatology only since 1993 (15). Based on the principals of LDF, LDI enables the measurement of blood flow over a larger area (e.g. finger, hand) rather than a single site and the laser beam is non-contact as opposed to the single probe (LDF) which gives this technique two major advantages over LDF (16).
3) Cross-Polarized Diffuse Reflectance Imaging System
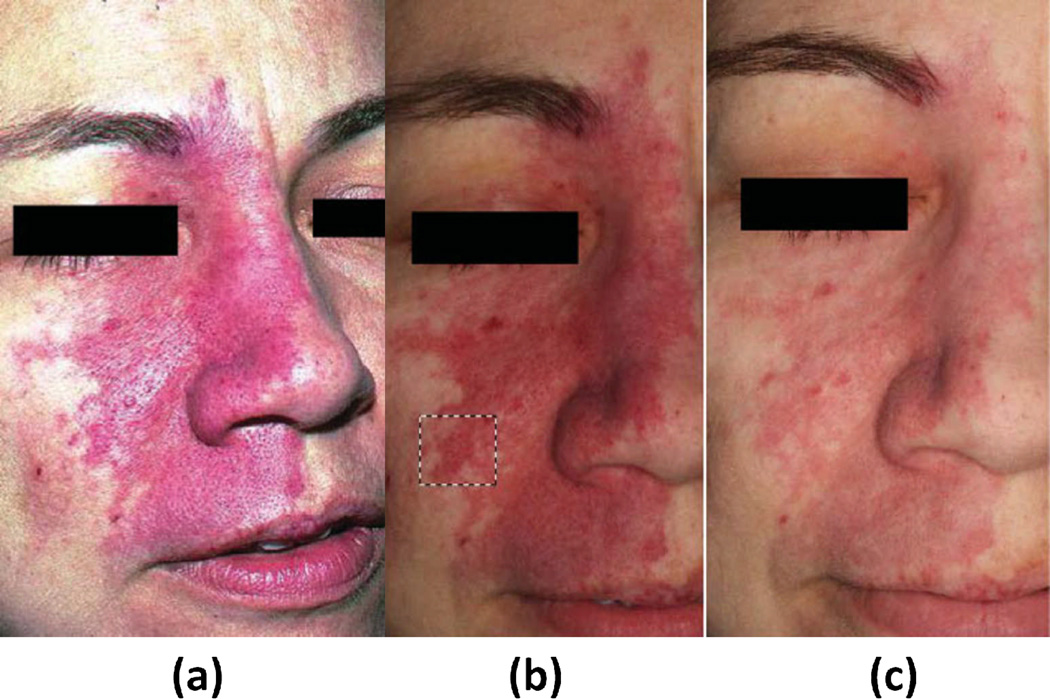
Another approach for wide-field assessment of PWS is cross-polarized diffuse reflectance (CDR) color imaging (17). CDR provides another means for quantitative measurements of erythema and melanin in PWS skin, but within an imaging context rather than a point-by-point format. In this approach, a consumer grade digital color camera acquires images from PWS patients, providing RGB images. Crossed Polarizers remove specular reflectance, improving image quality and enabling visualization of subsurface skin information related to tissue composition. (Figure 3.)
Figure 3.
Color image of port wine stain (PWS) skin taken without use of crossed polarizers to illustrate the effect of glare (a). Cross-polarized diffuse reflectance color image taken (b) before and (c) next patient’s visitation, (4–8 weeks) after a single pulsed dye laser (PDL) treatment. Dashed black lines denote area used in subsequent erythema analysis. Although the contrast between normal and PWS skin appears to be more pronounced due to weaker lighting in image B, lighting artifacts can be discounted as the images were taken in dark environments, independent of background lighting. {Used with permission from Ref. (8)}
Camera output is displayed on a color monitor to ensure that test sites identified on the skin were reproducibly positioned while a custom device consisting of head and chin rests mounted on a rotary stage allowing for subject positioning at angles from 0 degree (front profile) and 90 degree (side profile). Using the 99% diffuse reflectance plate, average RGB values of acquired diffuse reflectance images were calculated as 251.7, 253.7, and 252.1, respectively, with standard deviations of ~1. To test system repeatability, images of the same plate were acquired on five different days. RGB values (mean & standard deviation) were 250±1.3, 252±1.7, and 251±1.2, respectively, demonstrating the stability and reproducibility of the imaging system for subjects who are imaged multiple times over the course of many treatments (8). Image analysis assesses the degree of erythema and melanin in selected PWS regions. This imaging system is advantageous as it gathers information from a relatively large area.
CDR is limited as the effect of curvature on image reliability has not been carefully characterized yet and regions of interest should be ideally planar, impossible for most PWS cases. Image analysis still requires user-friendly interface improvements before widespread clinical deployment, while variations in background lighting, positioning, measurement distance, and camera angle can introduce imaging artifacts into the data. Finally, it appear that this approach is sensitive to fluctuations in background lighting. (Figure 3.)
4) Reflectance Confocal Microscopy
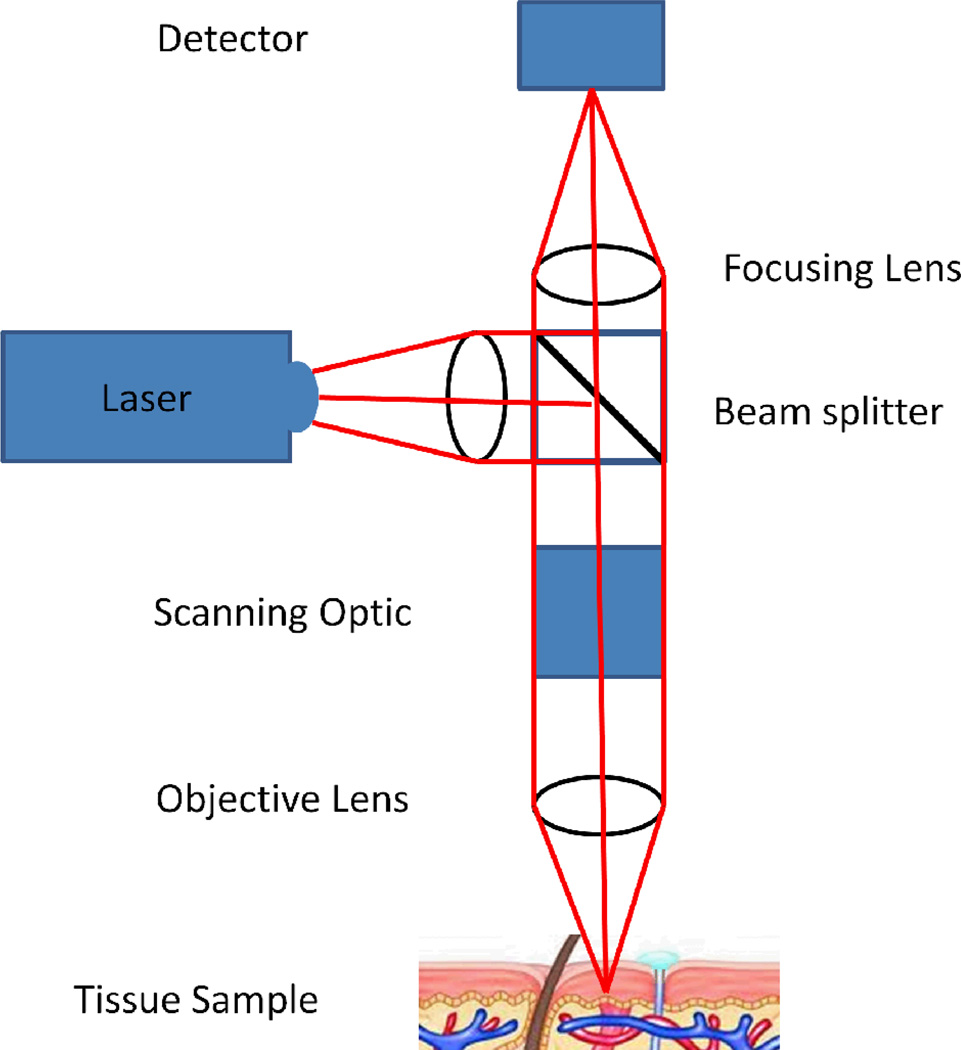
Reflectance confocal microscopy (RCM) is an emerging noninvasive diagnostic tool that provides in vivo tissue images at nearly cellular histological resolution (18, 19). Confocal images of human skin are shown with experimentally measured lateral resolution 0.5–1.0 microns and axial resolution (section thickness) 3–5 microns at near-infrared wavelengths, this resolution compares favorably to that of histology which is based on typically 5 micron thin sections (18, 19). RCM employs a low power near infrared laser that scans the skin horizontally, producing highly detailed black and white cellular images from the epidermis to the upper papillary dermis with an imaging depth of up to 200–300 µm.
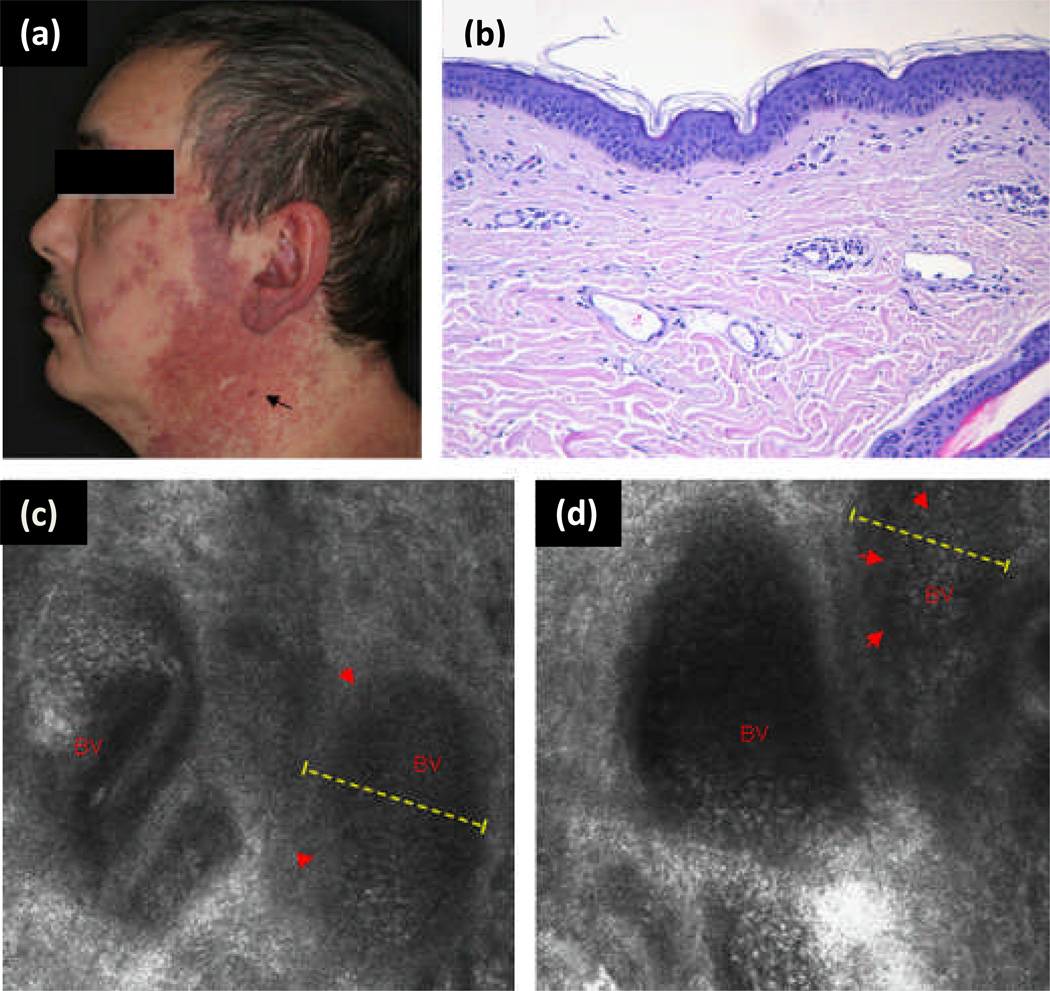
Reflectance confocal microscopy (RCM) has visualized noninvasive benign and malignant inflammatory and proliferative skin disorders in vivo (20). Aghassi and colleagues have described a benign angioma by visualizing the greater number of tortuous and dilated capillary loops in the upper dermal layer (20). Pre- and post-treatment images of PWS were obtained for monitoring of response to laser treatment, allowing analysis of vascular biology and providing a noninvasive method for quantifying size of vessels, density, and blood flow intensity. This technique is strongly user dependent during measurements, necessitating the placement of the objective lens onto an adapter ring in order to be fixed on the lesion, limiting penetration depth of 250 to 300 µm, which prevents the assessment of deeper vascular structures. Individual documented PWS vessels range from 75 µm to well over 100 µm in diameter and are typically located in papillary layer of upper dermis (20) compared to normal vessels with average diameter of 17 µm (21). Additionally, the system is extremely sensitive to motion during the imaging process, a significant limitation particularly in the diagnosis of vascular pathology in children for whom control of body movement is not as easily maintained. With evolution over time, this method can provide new insights into the dynamics of cutaneous vascular pathology. RCM may be a promising new tool for noninvasive diagnosis of vascular anomalies in vivo (20).
5) Optical Coherence Tomography
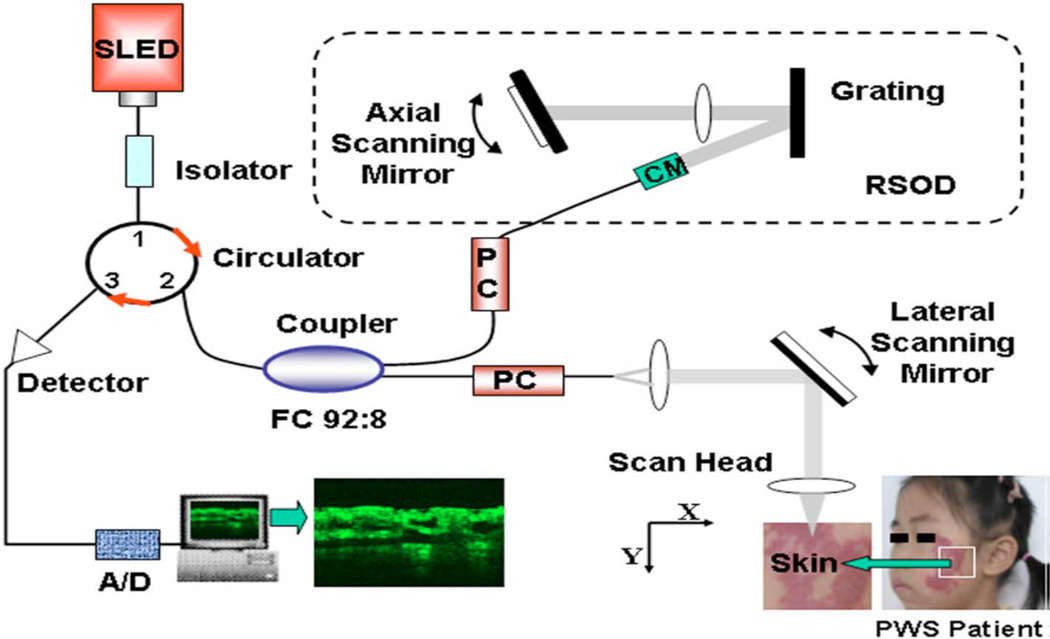
Optical coherence tomography (OCT) is a modality that enables high-resolution in-vivo imaging of subsurface structures. OCT has achieved high-resolution noninvasive imaging of living biological tissues, analogous to ultrasound. The use of relatively long wavelength light allows tissue penetration up to 1 mm. OCT fills a valuable niche in biomedical optics by providing accurate in vivo subsurface structural imaging in 3 dimensions. Figure 6 shows a schematic of OCT imaging system. A broadband near-infrared light source (super luminescent diode laser) in combination with a Michelson interferometer produces 2 beams: one beam focused on the specimen and the other, a reference. Light reflected from tissue and reference mirrors is combined at the detector. When the optical path lengths are similar for the target and reference beams, interference patterns are formed, and signal-processing algorithms translate the interference patterns into 2- or 3-dimensional gray-scale or false-color maps. The depth of the structure imaged in the tissue can be measured by noting the position of the scanning mirror at which an interference pattern is observed (22).
Figure 6.
Schematic of OCT imaging system. It uses a super luminescent laser and a spectral FWHM. After digital signal processing (DSP), structure OCT image is generated. {Used with permission from Ref. (23)}
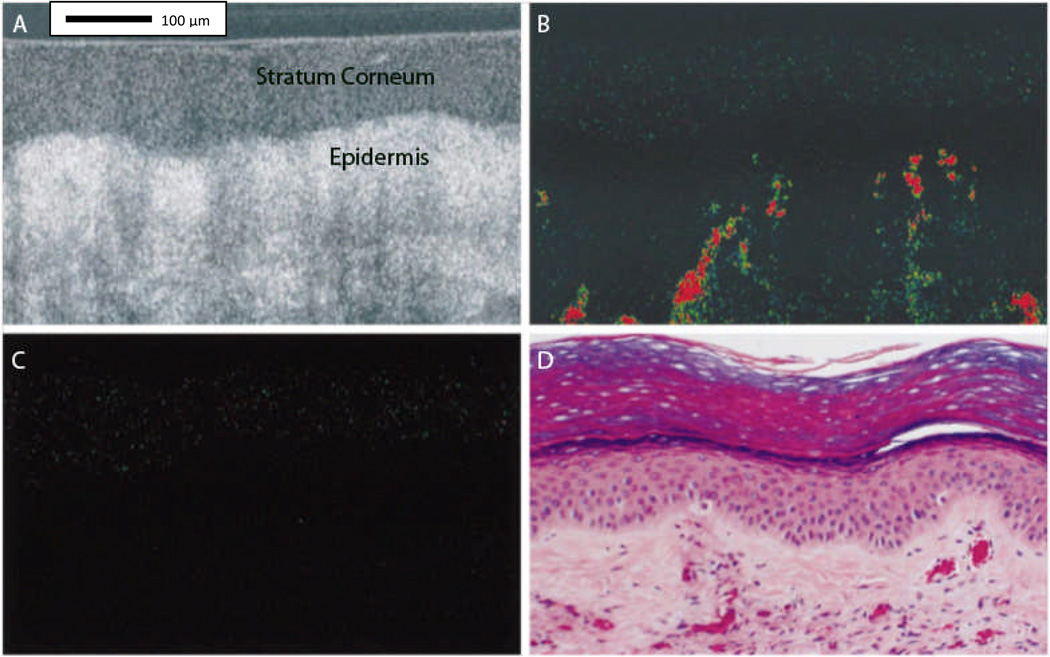
Optical Coherence Tomography (OCT), can be used for skin vascular lesions in situ, in vivo, and in real-time (Figure 7.), making the noninvasive detection of skin disease possible (23). OCT’s limited penetration depth of 1 mm prevents detection of blood vessels in deeper dermis. The vascular structure of normal skin, on the order of about 10 microns, typically cannot be displayed clearly with the resolution of current OCT systems, which have a resolution of axial and transverse resolutions of 10 and 9 microns, respectively (20, 23). It should be noted that as the systems evolve and improve in resolution, resolution limits are expected to diminish.
Figure 7.
Tomographic images taken in situ from human port-wine stained skin (PWS). Image A, Conventional optical coherence tomographic (OCT) image before laser exposure. Optical Doppler tomographic (ODT) blood flow images before (B) and immediately after (C) laser exposure. Images A, B, and C are the same skin site with a fixed probe beam. Images B and C, Color-coded tomographic images of blood flow velocity. PWS vessels not seen on the conventional OCT image (A) are detected in the dermis in the ODT image before laser exposure (B). Blood flow is absent in the ODT image immediately after laser exposure (C). Image D, Hematoxylin-eosin–stained histologic section from the imaged site. Comparable PWS blood vessels are noted in images B and D. {Used with permission from Ref. (22)}
Several variations of OCT have emerged, including optical Doppler tomography (ODT), which combines OCT with LDF to obtain high-resolution tomographic images of static and moving constituents in highly scattering biological tissues.(22)
6) Laser Speckle Imaging (LSI)
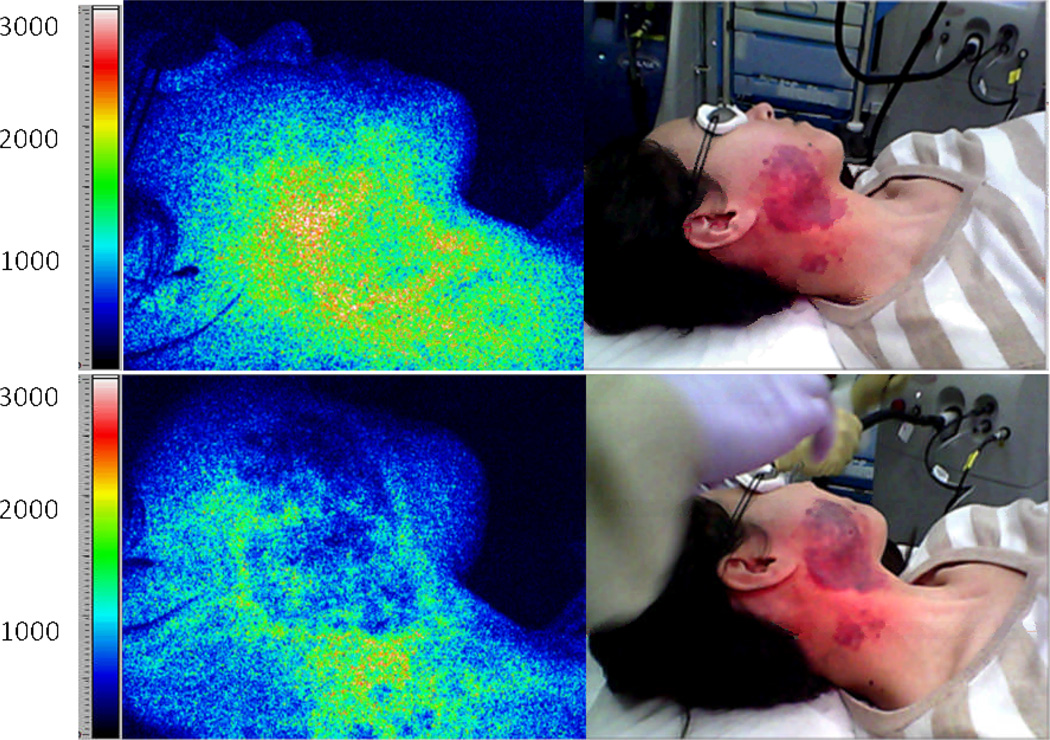
Laser speckle imaging (LSI) is a technique sensitive to the degree of motion of optical scatterers, such as red blood cells. LSI relies on single image acquisition and analysis of an exposure time considerably longer than a characteristic correlation time associated with the fluctuation frequency. A faster blood flow appears more blurred in the captured image than regions of slower or no flow. The degree of blurring is quantified as the local speckle contrast value, with zero contrast (no speckle pattern) corresponding to high blood flow, and unity contrast (fully developed speckle pattern) to no flow.
Coherent laser light (e.g., 633-nm HeNe laser) is delivered to the target area. Raw speckle reflectance images are collected with a CCD camera. The images are converted to speckle contrast images and to maps with numeric values (i.e., Speckle Flow Index, or SFI) proportional to the degree of scatterer motion.
Prior to laser surgery, the PWS region is often associated with higher SFI values than normal surrounding skin (12, 15). After one treatment of laser surgery using a pulsed dye laser, a decrease in SFI values typically occurs, indicating photocoagulation of the target microvasculature. LSI enables real-time identification of regions with persistent perfusion after laser surgery, enabling the clinician to make an informed decision on further patient treatments.
LSI instrumentation is relatively simple and uses SFI analysis performed with individual raw speckle reflectance images, eliminating motion artifacts.
A potential limitation of LSI is that the SFI values also are dependent on tissue optical properties. Visible color changes are observed during laser surgery, and are reflective in changing SFI values due to the absence of perfusion changes. Preliminary computational modeling data (unpublished) suggest SFI decreases due to light absorption changes are associated with blood clot formation. For laser treatment of PWS birthmarks, SFI may serve more as a metric of the degree of photocoagulation, a critical valuable to the clinician, more so than the metrics of blood-flow change.
7) Spatial Frequency Domain Imaging (SFDI)
Spatial Frequency Domain Imaging (SFDI) is a non-contact imaging method based on diffuse optical spectroscopy (DOS) principles, with detailed descriptions in technical literature (24, 25). SFDI provides quantitative two-dimensional maps of optical properties (absorption and reduced scattering coefficient) of tissue. At several different wavelengths, corresponding to hemoglobin absorption bands, this method quantitatively maps oxy-hemoglobin, deoxy-hemoglobin, tissue oxygen saturation, and total hemoglobin concentration, in superficial in-vivo tissue (1–5 mm).
The SFDI imaging system projects low-power near-infrared structured light patterns onto tissue of interest in a non-contact, reflection geometry and then capturing the reflectance with a camera. Typically the camera is a scientific CCD camera; however in general, any digital camera might be used, assuming that it is sensitive to the appropriate wavelengths of light. Currently, light sources used for this approach have ranged from broadband quartz-tungsten near infrared light source to discrete high-powered light emitting diodes (LEDs).
SFDI uses multiple-frequency structured illumination and model-based inversion to produce two-dimensional maps of tissue absorption and scattering properties. This scattering corrected absorption data is measured at multiple wavelengths and used to fit for the tissue concentration of intrinsic chromophores in each pixel. This is done with a priori knowledge of the basis spectra of common tissue chromophores, such as oxy-hemoglobin (ctO2Hb), deoxyhemoglobin (ctHHb) (24, 26).
Total Hemoglobin (ctTHb) concentration is referred to as the sum of ctO2Hb and ctHHb. stO2 is calculated by dividing ctO2Hb by ctTHb.
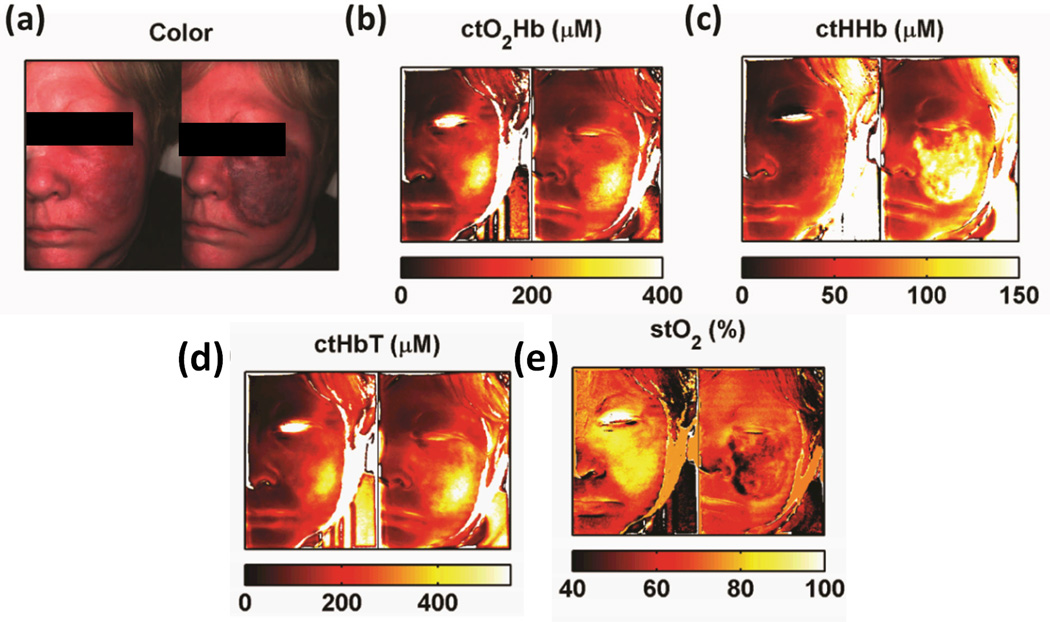
We present an example of SFDI results (Figure 9.) obtained from a 54-year-old PWS subject before treatment (left) and after laser treatment (right). Color images (9a) show post treatment skin darkening (purpura) due to blood pooling caused by the treatment’s laser destruction of venule plexuses. SFDI generated maps show increases in oxy-hemoglobin values (~50%) values (Fig. 9b), deoxy-hemoglobin values (~300%) (Fig 9c), and total hemoglobin (~60%) values in a region of interest (ROI) that underwent therapy. (Fig 9d). These changes are coupled with a decrease in tissue oxygen saturation (~40%) (Fig 9e) in the same ROI.
Figure 9.
Sample PWS Data Collection. Collage of pre-operative (left) and immediately post PDL (right) (a) color images, (b) oxy-hemoglobin maps, (c) deoxy-hemoglobin maps (d) total hemoglobin maps, and (e) tissue oxygen saturation maps.
In SFDI, melanin in very highly pigmented skin can potentially confound the accurate determination of deoxyhemoglobin concentration by overestimating it, giving incorrect values of tissue oxygen saturation. Numerous approaches adequately addressing the melanin issue are currently under investigation (27)
We present an example of SFDI results (Figure 9.) obtained from a 54-year-old PWS subject before treatment (left) and after laser treatment (right). Generated maps show an increased oxyhemoglobin concentration (O2Hb) (Fig. 9b), deoxyhemoglobin concentration (HHb) by 300% (Fig 9c), total hemoglobin (HbT) by 80% (Fig 9d), and a decrease in tissue oxygen saturation (stO2) (Fig 9e) in the laser treated regions. Color images (9a) show post treatment skin darkening (purpura) due to blood pooling caused by the treatment’s laser destruction of venule plexuses.
Conclusions
PWS consisting of ectatic blood vessels in the papillary and upper reticular dermis are most commonly treated with laser therapy with the intended goal of inducing acute photocoagulation of the PWS microvasculature, commonly assessed clinically with the metric of purpura (i.e., bluish-gray skin discoloration) formation. Due to the overall poor success rate of laser therapy to achieve complete PWS removal, a reasonable conclusion is that visible discoloration of the lesion itself is likely to be insufficient as a prognostic indicator, creating a critical need for additional information to better assess the degree of photocoagulation achieved during therapy.
To assess blood flow in PWS vessels, only a few studies exist in the peer-reviewed literature, using laser Doppler imaging or Doppler optical coherence tomography. Those who report using Doppler OCT for evaluation of PWS skin acknowledge the ability of blood flow characterization to monitor PWS skin during laser treatments to monitor photocoagulation of targeted vessels to prevent additional vessel damage and injuries to the overlying epidermis.
Currently, various existing optical techniques specifically designed for evaluation of cutaneous features have been investigated as tools for assessing PWS lesions. Scanning devices, such as colorimeters and tristimulus spectrophotometers are used and the most widely available objective techniques, but these are typically semi-quantitative and only report on tissue status in very small (up to 10 mm diameter) locations. Other techniques, including newly developed optical devices such as SFDI and LSI, offer relatively inexpensive means for assessing areas of tissue while visualizing functional status, SFDI also enables visualization of changes in tissue structure information in the form of scattering coefficients. OCT is also capable of reporting changes in structure, since it relies on microscopic scattering as its main source of contrast. Non-contact devices enable objective tissue assessment while avoiding artifacts, like blanching by pressure, that often accompany measurement devices requiring skin contact.
Figure 1.
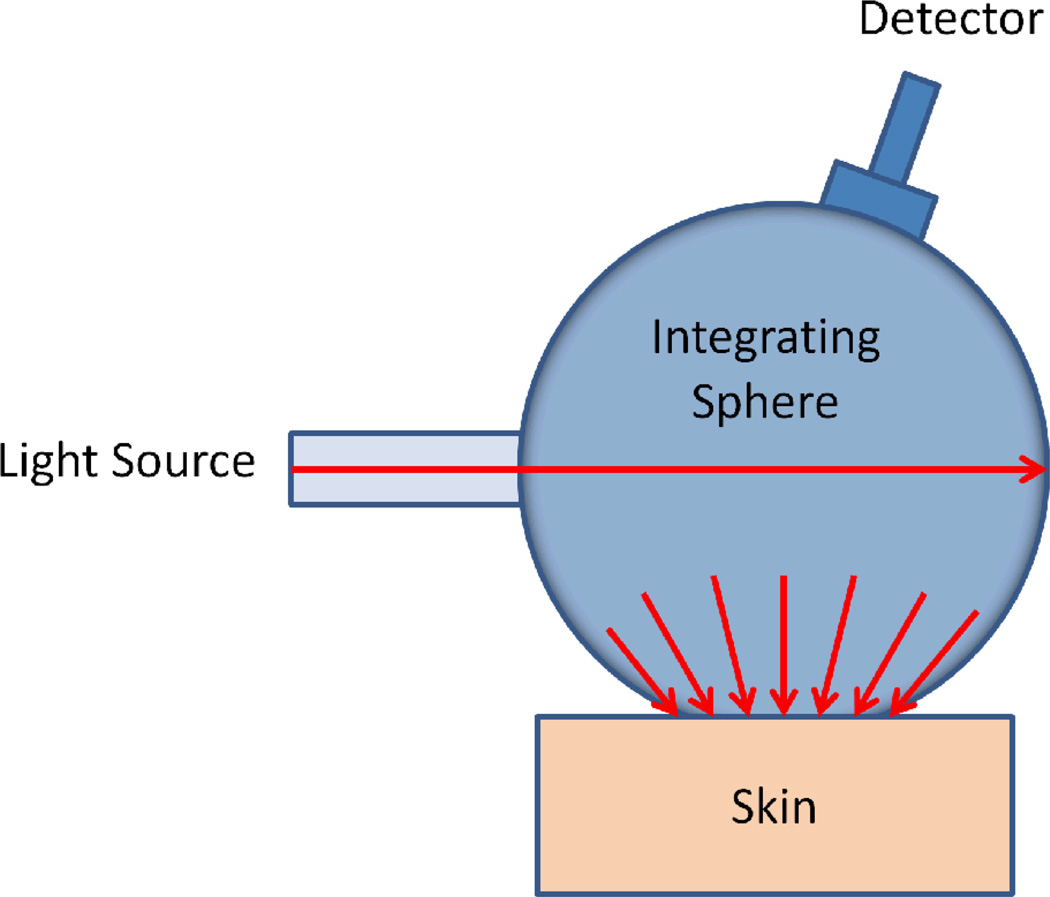
Schematic diagram showing a basic spectrophotometer setup. The integrating sphere is used for both producing a diffuse light source, and for collection of light from the skin surface.
Figure 2.
In LDF, a laser beam is directed at the tissue, with frequency of the reflected light, as altered by flowing red blood cells, indicating the concentration speed and volume of blood flow, termed collectively as “red blood cell flux”, through a region of interest. This flux value is assumed to be directly proportional to skin perfusion (28).
Figure 4.
A schematic illustration of a confocal microscope.
Figure 5.
(a) Clinical photograph of port wine stain (PWS) in trigeminal distribution on the face of a 46-year-old white man. Black arrow shows vascular nodule present within lesion. (b) Representative histology of a PWS with dilated postcapillary venules in the upper dermis. (c and d) Reflectance confocal microscopy (RCM) evaluation at the level of the upper dermis reveals medium-sized to large vessels as a distinct RCM feature of PWS (red arrowheads, dashed yellow line, blood vessel (BV)). In vivo RCM evaluation revealed medium flow velocity. {Used with permission from Ref. (20)}
Figure 8.
Representative example of LSI during laser surgery of PWS skin. Images of a PWS subject are shown before treatment (top frames) and after laser treatment (bottom frames). False color images (left) depict SFI values. The speckle flow index scale, which is a metric of blood flow, is shown next to each speckle flow image (14). The white/red portion of pretreatment tissue in the speckle flow image corresponds to relatively high flow. After laser treatment, the speckle flow index has decreased (green region), indicating that at perfusion has been reduced. At this point, there is not enough data to show whether LSI provides quantitative information that alone serves as a sufficient prognostic tool. Clinical data are currently analyzing and a new study is designing that focuses specifically on the relationship between purpura and SFI values.
Acknowledgements
The authors acknowledge salary support provided by the NIH NCRR Laser and Medical Microbeam Program, (LAMMP: P41EB05890); the NIH SBIRs R01 HD065536, 1R43RR030696-01A1, and 1R43RR025985-01, the Military Photomedicine Program, (AFOSR Grant#FA9550-08-1-0384), R01 AR054885, the Beckman Foundation and the Hazem Chehabi BLI Research Fellowship.
Footnotes
Conflict of interest
Dr. Durkin is a cofounder of the company and owns equity interests in Modulated Imaging Inc which collaborated in the development of the spatial frequency domain imaging (SFDI) system used here.
Citations
- 1.Chen JK, Ghasri P, Aguilar G, van Drooge AM, Wolkerstorfer A, Kelly KM, Heger M. An overview of clinical and experimental treatment modalities for port wine stains. J Am Acad Dermatol. 2012 doi: 10.1016/j.jaad.2011.11.938. [DOI] [PMC free article] [PubMed] [Google Scholar]
- 2.Tallman B, Tan OT, Morelli JG, Piepenbrink J, Stafford TJ, Trainor S, Weston WL. Location of port-wine stains and the likelihood of ophthalmic and/or central nervous system complications. Pediatrics. 1991;87(3):323–327. [PubMed] [Google Scholar]
- 3.Loewe R, Oble DA, Valero T, Zukerberg L, Mihm MC, Nelson JS. Stem cell marker upregulation in normal cutaneous vessels following pulsed-dye laser exposure and its abrogation by concurrent rapamycin administration: implications for treatment of port-wine stain birthmarks. Journal of Cutaneous Pathology. 2010;37:76–82. doi: 10.1111/j.1600-0560.2010.01520.x. [DOI] [PMC free article] [PubMed] [Google Scholar]
- 4.Kelly KM, Choi B, McFarlane S, Motosue A, Jung B, Khan MH, Ramirez-San-Juan JC, Nelson JS. Description and analysis of treatments for port-wine stain birthmarks. Arch Facial Plast Surg. 2005;7(5):287–294. doi: 10.1001/archfaci.7.5.287. [DOI] [PubMed] [Google Scholar]
- 5.Izikson L, Nelson JS, Anderson RR. Treatment of hypertrophic and resistant port wine stains with a 755 nm laser: a case series of 20 patients. Lasers Surg Med. 2009;41(6):427–432. doi: 10.1002/lsm.20793. [DOI] [PMC free article] [PubMed] [Google Scholar]
- 6.McMillan K. Use of Lasers to Treat Port Wine Stain Birthmarks. Applied Spectroscopy Reviews. 2003;38(4):495–511. [Google Scholar]
- 7.Koster PH, Bossuyt PM, van der Horst CM, Gijsbers GH, van Gemert MJ. Assessment of clinical outcome after flashlamp pumped pulsed dye laser treatment of portwine stains: a comprehensive questionnaire. Plast Reconstr Surg. 1998;102(1):42–48. doi: 10.1097/00006534-199807000-00007. [DOI] [PubMed] [Google Scholar]
- 8.Jung B, Choi B, Durkin AJ, Kelly KM, Nelson JS. Characterization of port wine stain skin erythema and melanin content using cross-polarized diffuse reflectance imaging. Lasers in Surgery and Medicine. 2004;34(2):174–181. doi: 10.1002/lsm.10242. [DOI] [PubMed] [Google Scholar]
- 9.Lister T, Wright P, Chappell P. Spectrophotometers for the clinical assessment of port-wine stain skin lesions: a review. Lasers in Medical Science. 2010;25(3):449–457. doi: 10.1007/s10103-009-0726-8. [DOI] [PubMed] [Google Scholar]
- 10.Clarys P, Alewaeters K, Lambrecht R, Barel AO. Skin color measurements: comparison between three instruments: the Chromameter(R), the DermaSpectrometer(R) and the Mexameter(R) Skin Res Technol. 2000;6(4):230–238. doi: 10.1034/j.1600-0846.2000.006004230.x. [DOI] [PubMed] [Google Scholar]
- 11.Shriver MD, Parra EJ. Comparison of narrow-band reflectance spectroscopy and tristimulus colorimetry for measurements of skin and hair color in persons of different biological ancestry. Am J Phys Anthropol. 2000;112(1):17–27. doi: 10.1002/(SICI)1096-8644(200005)112:1<17::AID-AJPA3>3.0.CO;2-D. [DOI] [PubMed] [Google Scholar]
- 12.Takiwaki H, Shirai S, Kanno Y, Watanabe Y, Arase S. Quantification of erythema and pigmentation using a videomicroscope and a computer. Br J Dermatol. 1994;131(1):85–92. doi: 10.1111/j.1365-2133.1994.tb08462.x. [DOI] [PubMed] [Google Scholar]
- 13.Huang Y-C, Tran N, Shumaker PR, Kelly K, Ross EV, Nelson JS, Choi B. Blood flow dynamics after laser therapy of port wine stain birthmarks. Lasers in Surgery and Medicine. 2009;41(8):563–571. doi: 10.1002/lsm.20840. [DOI] [PMC free article] [PubMed] [Google Scholar]
- 14.Huang Y-C, Ringold TL, Nelson JS, Choi B. Noninvasive blood flow imaging for real-time feedback during laser therapy of port wine stain birthmarks. Lasers in Surgery and Medicine. 2008;40(3):167–173. doi: 10.1002/lsm.20619. [DOI] [PMC free article] [PubMed] [Google Scholar]
- 15.Harrison DK, Abbot NC, Beck JS, McCollum PT. A preliminary assessment of laser Doppler perfusion imaging in human skin using the tuberculin reaction as a model. Physiol Meas. 1993;14(3):241–252. doi: 10.1088/0967-3334/14/3/002. [DOI] [PubMed] [Google Scholar]
- 16.Murray AK. Laser Doppler imaging: a developing technique for application in the rheumatic diseases. Rheumatology. 2004;43(10):1210–1218. doi: 10.1093/rheumatology/keh275. [DOI] [PubMed] [Google Scholar]
- 17.Kim CS, Kim MK, Jung B, Choi B, Verkruysse W, Jeong MY, Nelson JS. Determination of an optimized conversion matrix for device independent skin color image analysis. Lasers Surg Med. 2005;37(2):138–143. doi: 10.1002/lsm.20219. [DOI] [PubMed] [Google Scholar]
- 18.Rajadhyaksha M, Gonzalez S, Zavislan JM, Anderson RR, Webb RH. In vivo confocal scanning laser microscopy of human skin II: advances in instrumentation and comparison with histology. J Invest Dermatol. 1999;113(3):293–303. doi: 10.1046/j.1523-1747.1999.00690.x. [DOI] [PubMed] [Google Scholar]
- 19.Rajadhyaksha M, Grossman M, Esterowitz D, Webb RH, Anderson RR. In vivo confocal scanning laser microscopy of human skin: melanin provides strong contrast. J Invest Dermatol. 1995;104(6):946–952. doi: 10.1111/1523-1747.ep12606215. [DOI] [PubMed] [Google Scholar]
- 20.Astner S, Gonzalez S, Cuevas J, Rowert-Huber J, Sterry W, Stockfleth E, Ulrich M. Preliminary evaluation of benign vascular lesions using in vivo reflectance confocal microscopy. Dermatol Surg. 2010;36(7):1099–1110. doi: 10.1111/j.1524-4725.2010.01590.x. [DOI] [PubMed] [Google Scholar]
- 21.Chang CJ, Yu JS, Nelson JS. Confocal microscopy study of neurovascular distribution in facial port wine stains (capillary malformation) J Formos Med Assoc. 2008;107(7):559–566. doi: 10.1016/S0929-6646(08)60169-2. [DOI] [PubMed] [Google Scholar]
- 22.Nelson JS, Kelly KM, Zhao Y, Chen Z. Imaging blood flow in human port-wine stain in situ and in real time using optical Doppler tomography. Arch Dermatol. 2001;137(6):741–744. [PubMed] [Google Scholar]
- 23.Zhao S, Gu Y, Xue P, Guo J, Shen T, Wang T, Huang N, Zhang L, Qiu H, Yu X, Wei X. Imaging port wine stains by fiber optical coherence tomography. Journal of Biomedical Optics. 2010;15(3) doi: 10.1117/1.3445712. 036020. [DOI] [PubMed] [Google Scholar]
- 24.Cuccia DJ, Bevilacqua F, Durkin AJ, Ayers FR, Tromberg BJ. Quantitation and mapping of tissue optical properties using modulated imaging. J Biomed Opt. 2009;14(2) doi: 10.1117/1.3088140. 024012. [DOI] [PMC free article] [PubMed] [Google Scholar]
- 25.Cuccia DJ, Bevilacqua F, Durkin AJ, Tromberg BJ. Modulated imaging: quantitative analysis and tomography of turbid media in the spatial-frequency domain. Opt Lett. 2005;30(11):1354–1356. doi: 10.1364/ol.30.001354. [DOI] [PubMed] [Google Scholar]
- 26.Gioux S, Mazhar A, Lee BT, Lin SJ, Tobias AM, Cuccia DJ, Stockdale A, Oketokoun R, Ashitate Y, Kelly E, Weinmann M, Durr NJ, Moffitt LA, Durkin AJ, Tromberg BJ, Frangioni JV. First-in-human pilot study of a spatial frequency domain oxygenation imaging system. J Biomed Opt. 2011;16(8) doi: 10.1117/1.3614566. 086015. [DOI] [PMC free article] [PubMed] [Google Scholar]
- 27.Yudovsky D, Durkin AJ. Spatial frequency domain spectroscopy of two layer media. J Biomed Opt. 2011;16(10) doi: 10.1117/1.3640814. 107005. [DOI] [PMC free article] [PubMed] [Google Scholar]
- 28.Hodges GJ. Hodges Lab. 2012 Retrieved from University of Alabama Faculty: http://education.ua.edu/faculty-staff/gary-j-hodges/ [Google Scholar]


