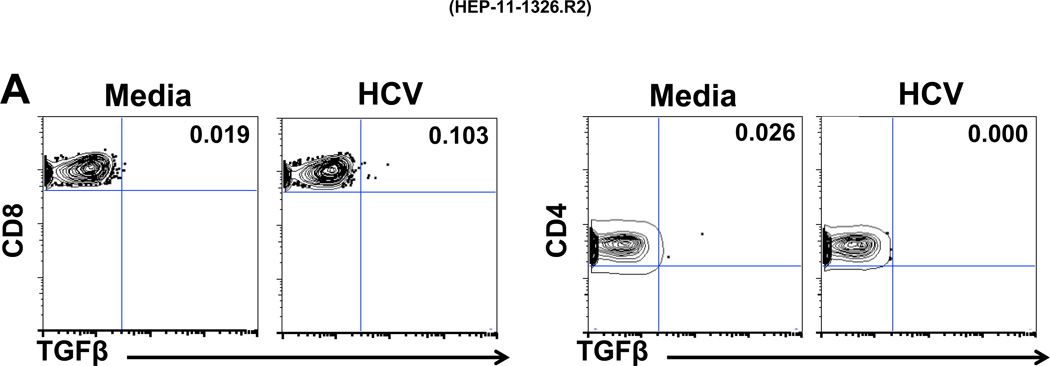
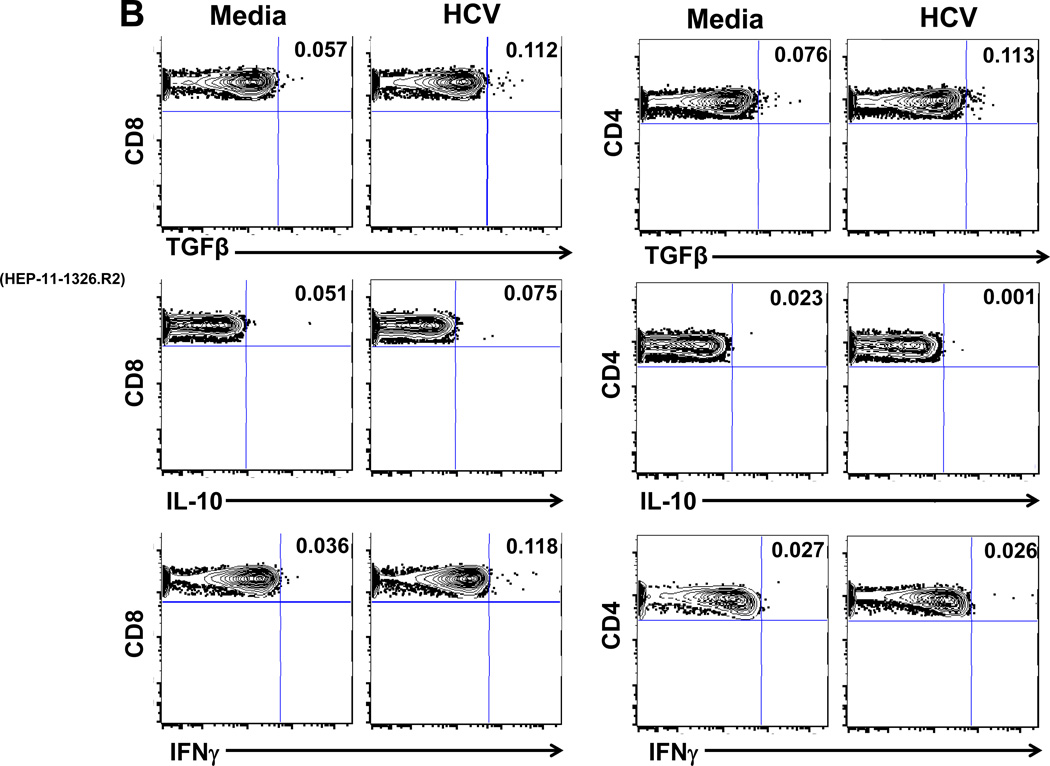
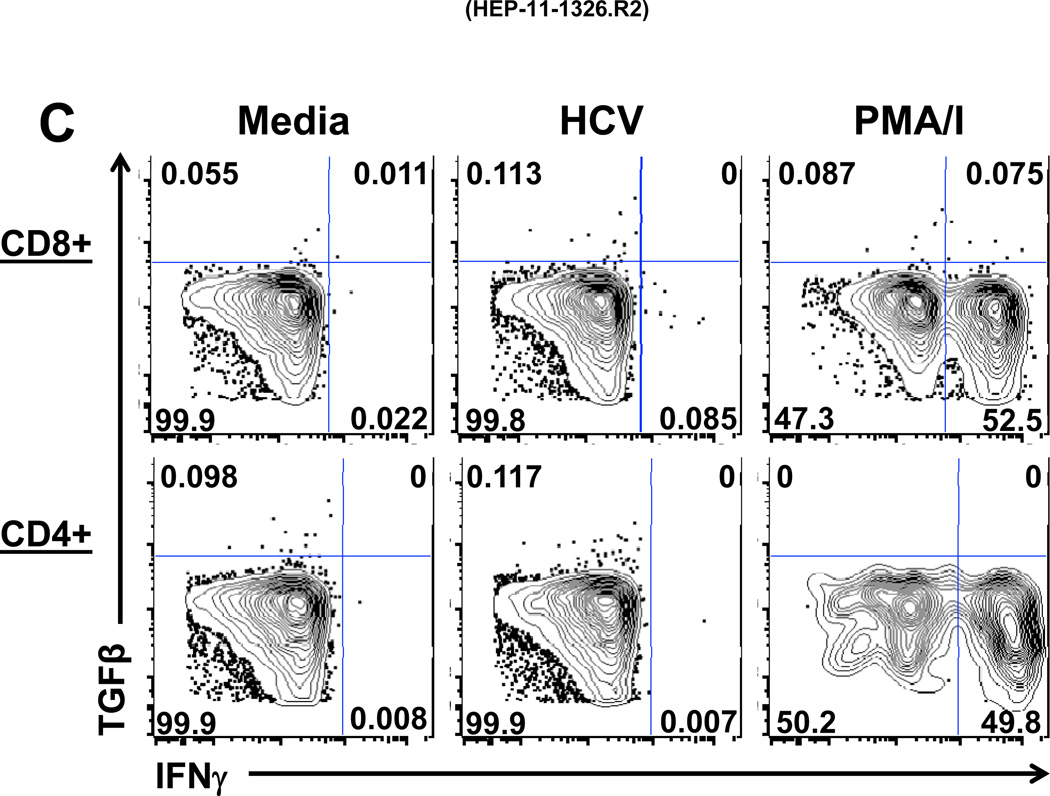
Figure 4. Frequencies of T cells producing TGFβ, IFNγ and IL-10 in response to HCV.
ICS multicolor FACS analysis was performed on PBMC from two subjects A (4A) and B (4B and 4C). 150,000 events were acquired, of which 50,000 to 100,000 were gated viable cells. The staining rates for all isotype controls were low (<0.02%) (not shown). Gating on CD8+CD3+ lymphocytes and CD4+CD3+ lymphocytes, in response to HCV stimulation, showed production of TGFβ by CD8+ T cells in patient A (4A) and by both CD8+ and CD4+ T cells, IFNγ from by CD8+ T cells and little IL-10 from patient B (4B). The T cell population producing TGFβ was distinct from the T cell population producing IFNγ (C). Stimulation with PMA/I (phorbol myristate acetate / ionomycin) was used as technical control.


