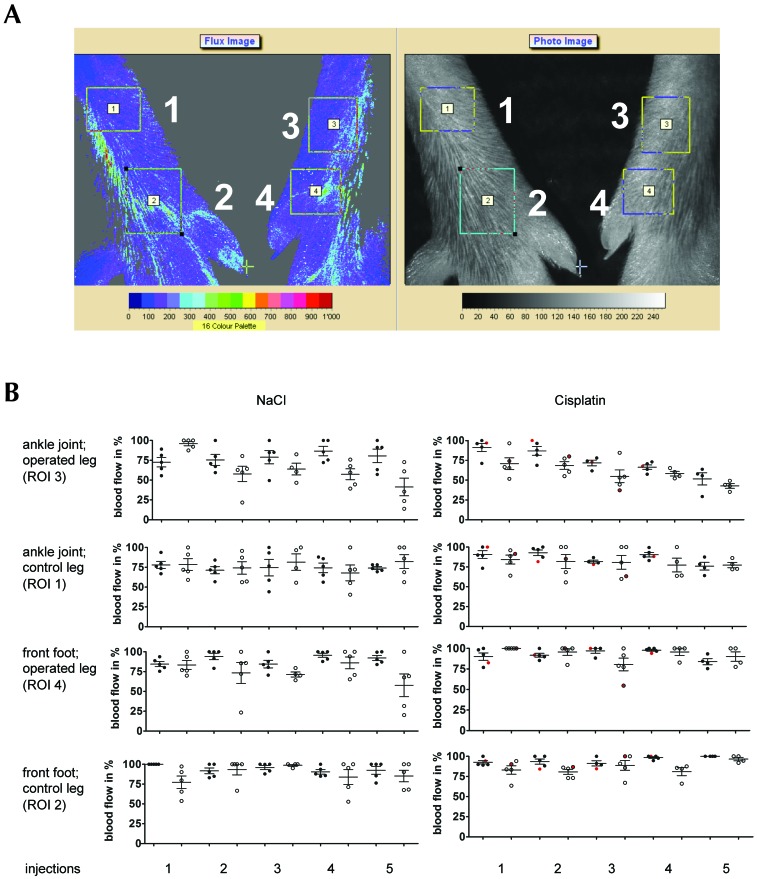
Figure 3.
Blood flow in mouse hindlimbs before and 10 min after repeated catheterization of the femoral artery and infusion of sodium chloride (control mice) or cisplatin at 3-d intervals. (A) Representative images of blood flow (left) and photo (right) of control (left) and catheterized (right) legs in indicated regions of interest around the ankle (1, 3) and forefoot (2, 4). (B) Mean (± 1 SD) and single blood flow measurements in percentage of highest value recorded in mice before (filled circles) and 10 min after (open circles) catheterization and repeated infusion (maximum, 5) of NaCl (left) or cisplatin (right). The single values obtained from a cisplatin-treated mouse that had only 3 successful catheterizations are shown in red.

