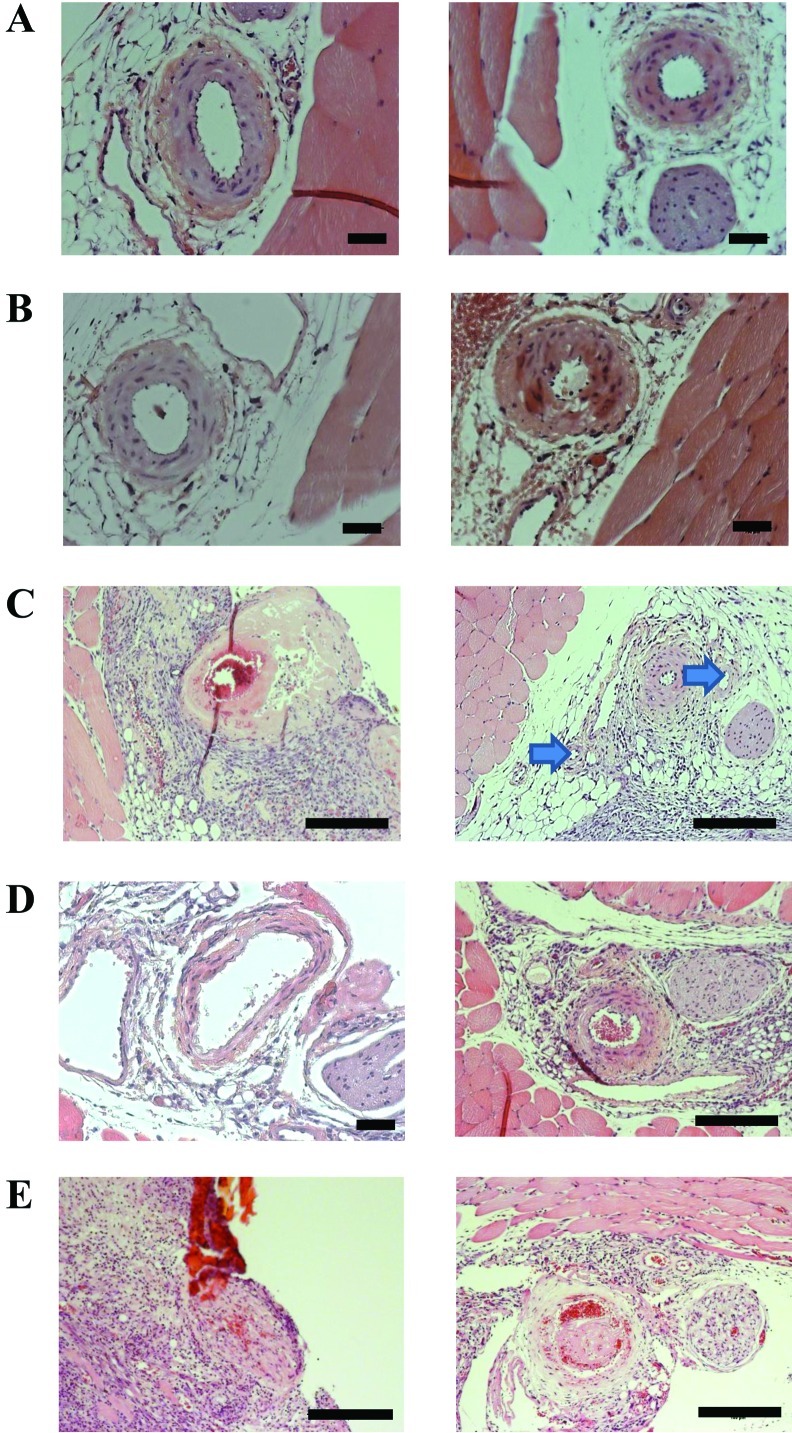
Figure 4.
Histology of nonoperated control and of catheterized and infused mouse hindlimbs. Images of 2 randomly selected (A) control legs; legs catheterized and infused with saline (B) once, (C) 3 times (arrows indicate collateral vessels), or (D) 5 times; and (E) a leg catheterized and infused with cisplatin 5 times (right panel) and from a leg after a failed fourth injection (left panel). Hematoxylin and eosin stain; scale bars, 100 μm.

