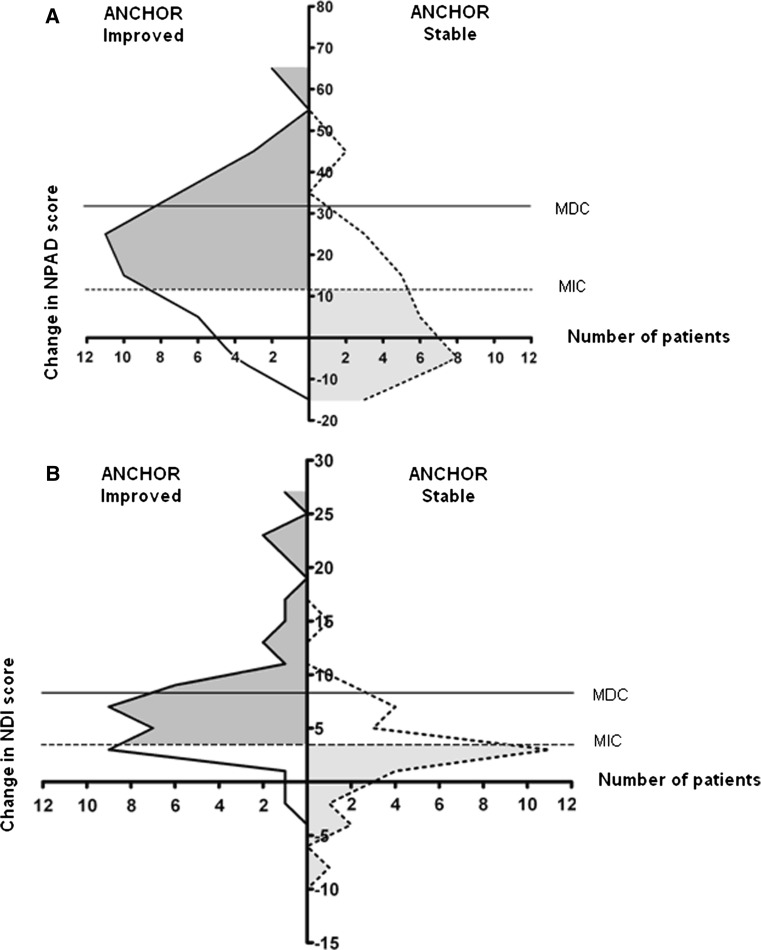
Fig. 2.
Distribution of NPAD-change scores in anchor-based improved and stable patients with indication of MIC at 11.5. At this point sensitivity = 0.74 and specificity = 0.70 (a). Distribution of NDI-change scores in anchor-based improved and stable patients with indication of MIC at 3.5. At this point sensitivity = 0.74 and specificity = 0.66 (b). Solid curve represents improved patients and dotted curve represents stable patients. The gray parts of the improved and stable patients represent the true positives (dark gray) and the true negatives (light gray), respectively. MDC is indicated at 31.7 for NPAD and at 8.4 for NDI

