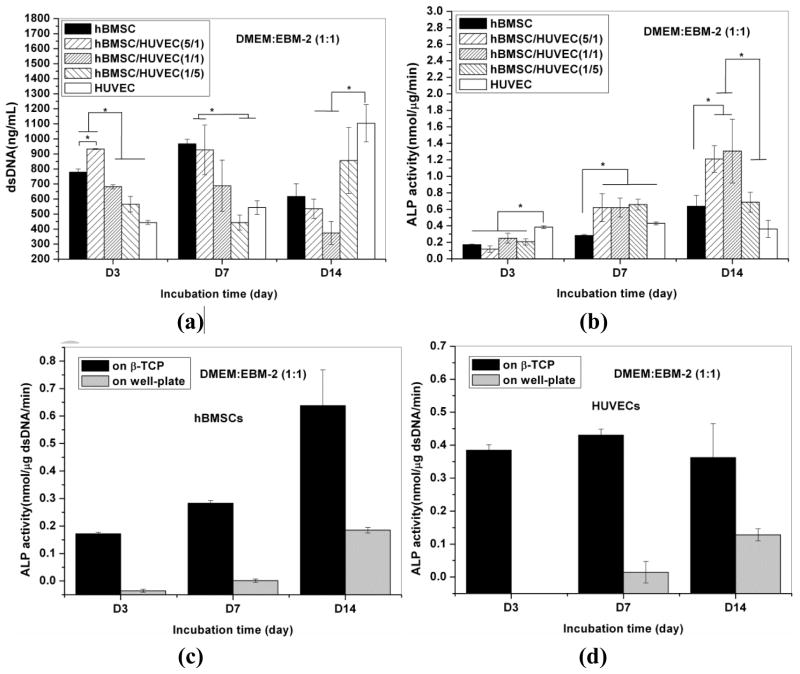
Fig. 6.
dsDNA contents of cells in monocultured hBMSCs and HUVECs, and co-cultured hBMSCs/HUVECs at various ratio on the β-TCP scaffolds (a), and ALP activity expression in hBMSCs cells on the β-TCP scaffolds in monocultures and co-culture after 3, 7, 14 days of incubation (b). ALP activity in monoculture hBMSCs (c) and HUVECs (d) on well plate and β-TCP scaffolds. A star (*) is used to indicate show significant difference (p<0.05).

