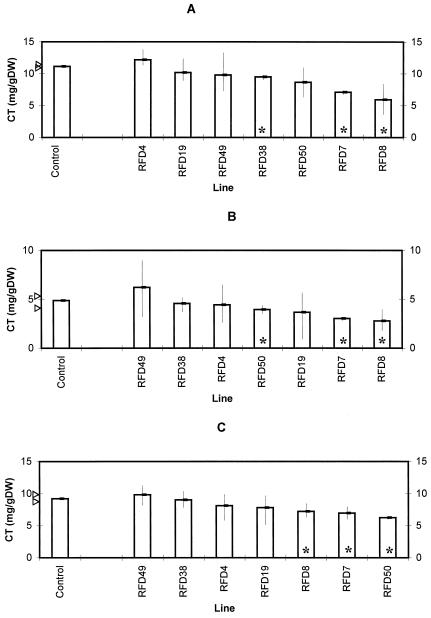
Figure 6.
Levels of condensed tannin (CT) in S33 control plants and lines harboring the pMAJ2 construct. Bars represent mean values, and the control bars correspond to the mean of lines S33, C26, C28, and C32. For each control and antisense line three replicate plants were analyzed. Arrows indicate 85% confidence limits for the median of the control condensed tannin values using the sign test. Vertical lines indicate the range of values noted for each antisense line. Asterisks indicate antisense ranges outside of the control confidence intervals. A, Juvenile growth; B, leaves; and C, stems. DW, Dry weight.

