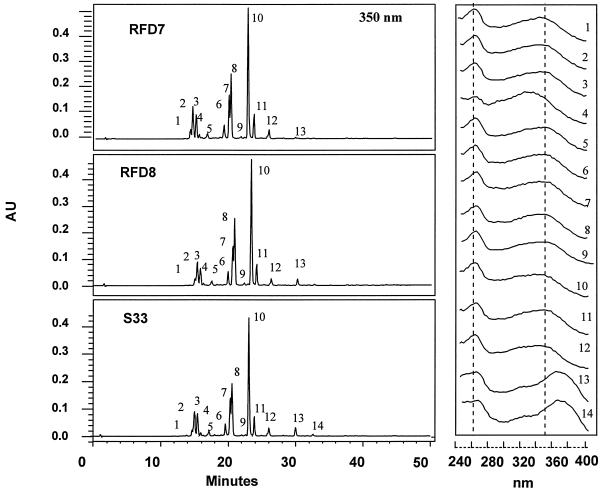
Figure 8.
HPLC profile and UV/visible spectra of MeOH extracts of 6-week-old shoot tissues from control (S33) and AS-DFR lines (RFD7 and RFD 8) of L. corniculatus. Condensed tannin contents of these lines were: S33, 10.7 mg/g dry weight; RFD7, 7.1 mg/g dry weight (66% of control level); and RFD8, 5.9 mg/g dry weight (55% of control level). Extracts from equivalent amounts of tissue were subjected to HPLC with diode-array detection. HPLC profiles were monitored at 350 nm and spectra were recorded between 240 and 400 nm. Chemical analysis indicated that the majority of peaks were either kaempferol or kaempferol glycosides (peaks 1–3 and 5–13). Identified peaks are: kaempferol (peak 13), kaempferol-3-rhamnoside-7-glucoside (peak 7), kaempferol-3-glucoside (peak 8), kaempferol-3-rhamnoside (peak 9), kaempferol-3,7-dirhamnoside (peak 10), and kaempferol-7-rhamnoside (peak 11).

