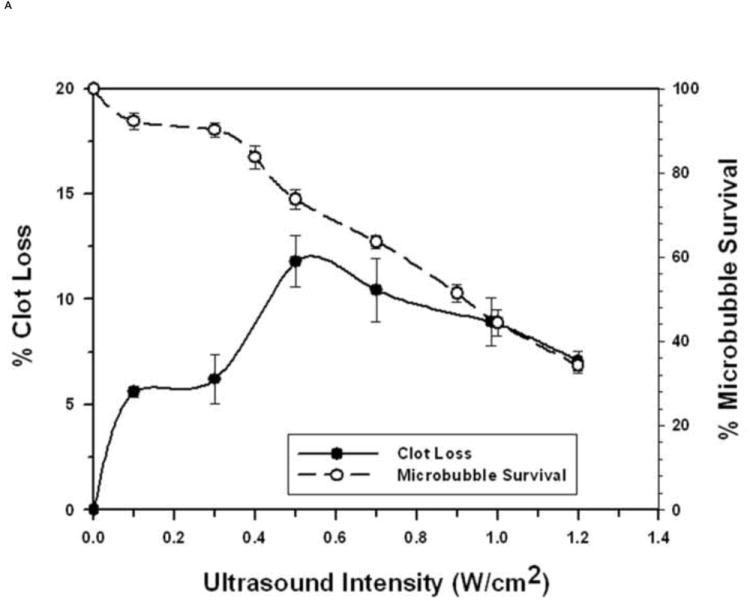
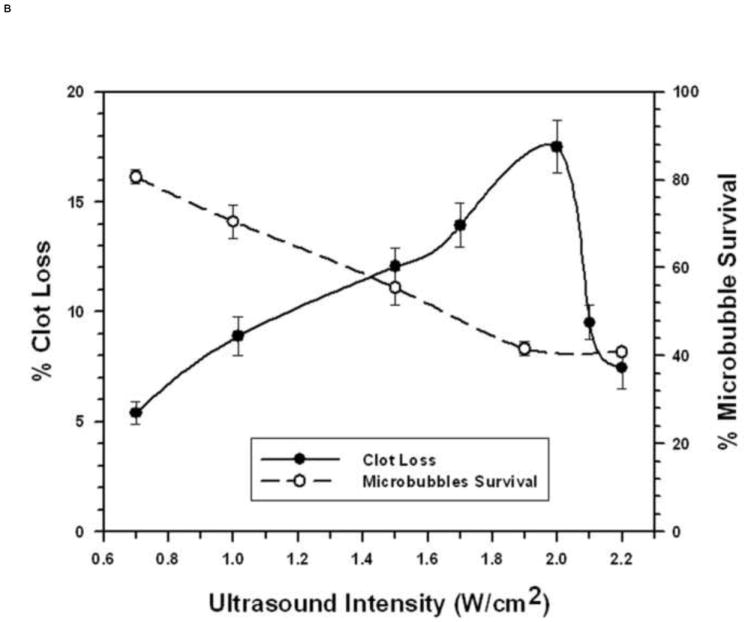
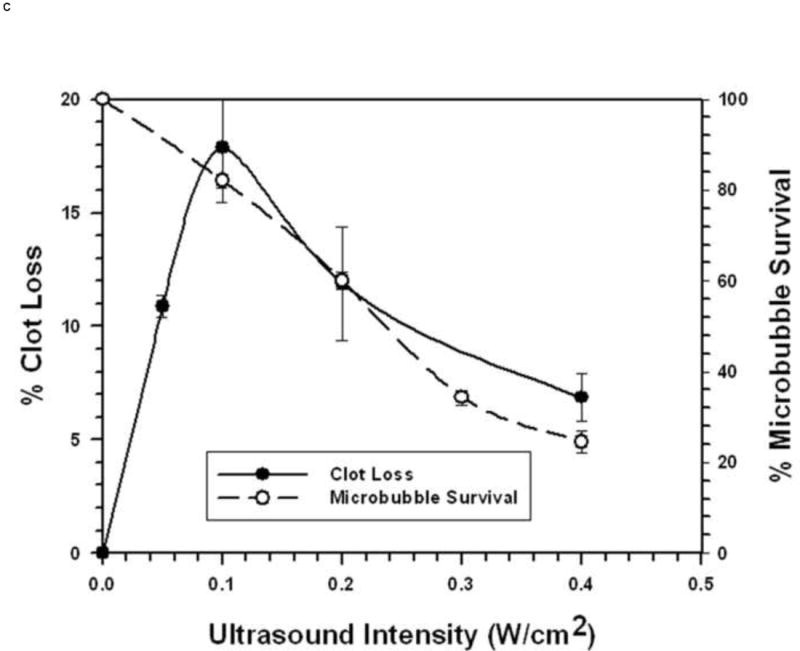
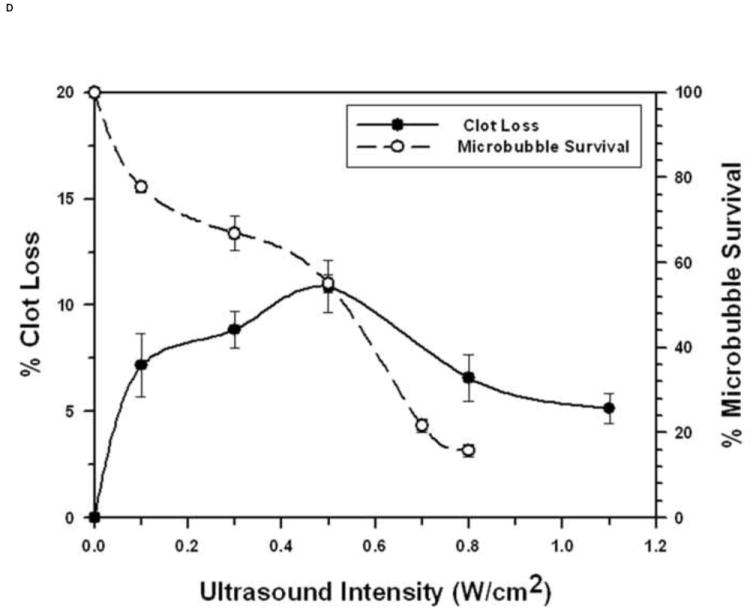
FIGURE 3. Microbubble Survival as a Function of Ultrasonic Intensity.


Each symbol represents the mean of a minimum of four measurements and the error bars indicate standard deviation.
A: With 1 μm diameter Microbubbles at 1 MHz.
B: With 1 μm diameter Microbubbles at 3 MHz.
C: With 3 μm diameter Microbubbles at 1 MHz.
D: With 3 μm diameter Microbubbles at 3 MHz.
