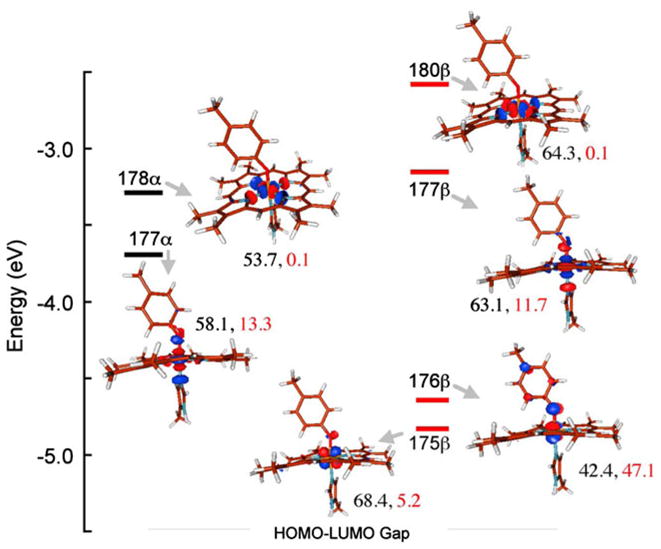
Fig. 10.

Valence energy level diagram obtained from geometry-optimized DFT calculations on the Fe(IV) S = 1 heme B. Contour plots were generated in Molden. The Fe (3d) and deprotonate Tyr contributions to the total Mulliken populations are shown next to each contour in black and red, respectively. HOMO highest occupied molecular orbital, LUMO lowest unoccupied molecular orbital
