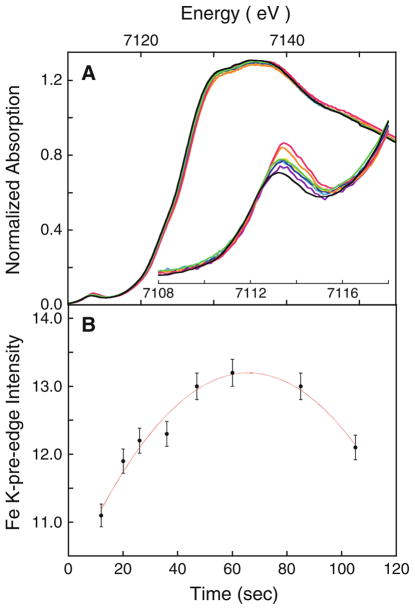
Fig. 5.
A normalized Fe K-edge X-ray absorption spectroscopy (XAS) data for diferric MauG treated with H2O2 and flash-frozen at different time intervals (purple curve 12 s, light-blue curve 20 s, yellow curve 26 s, blue curve 36 s, orange curve 47 s, pink curve 60 s, green curve 85 s, black curve 105 s).The inset shows the expanded pre-edge region. B change in the Fe K-pre-edge integrated area with time of exposure. The bisFe(IV) MauG sample frozen at 60 s was used in the detailed XAS studies

