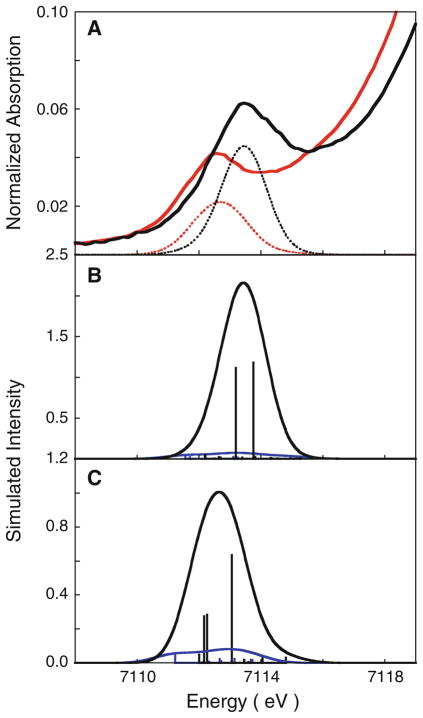
Fig. 7.
A a comparison of the time-dependent density functional theory (DFT) simulated (dotted line) and experimental (solid line) spectra for diferric MauG (red curve) and bisFe(IV) MauG (black curve). Individual contributions from the heme A (black curve) and heme B (blue curve) sites for B bisFe(IV) MauG and C diferric MauG

