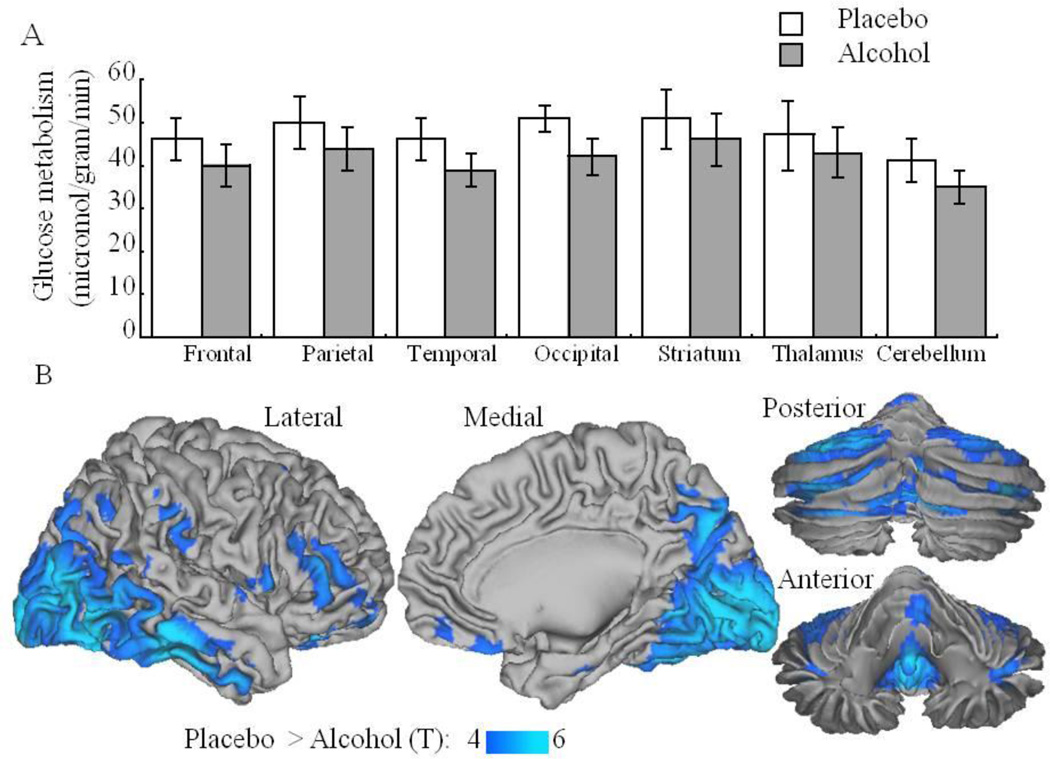
Figure 2.
A. Regional brain glucose metabolic values in the preselected large regions of interest during placebo and during alcohol intoxication (20 minutes after alcohol consumption). Metabolic values in all regions were significantly lower for alcohol than for placebo (p <0.001); B. Results from the SPM analysis on the normalized glucose metabolic image Alcohol > Placebo (p<0.005, uncorrected) superimposed on the surface of the right cerebrum (lateral and medial) and the cerebellum (posterior and anterior) of the human Colin template.

