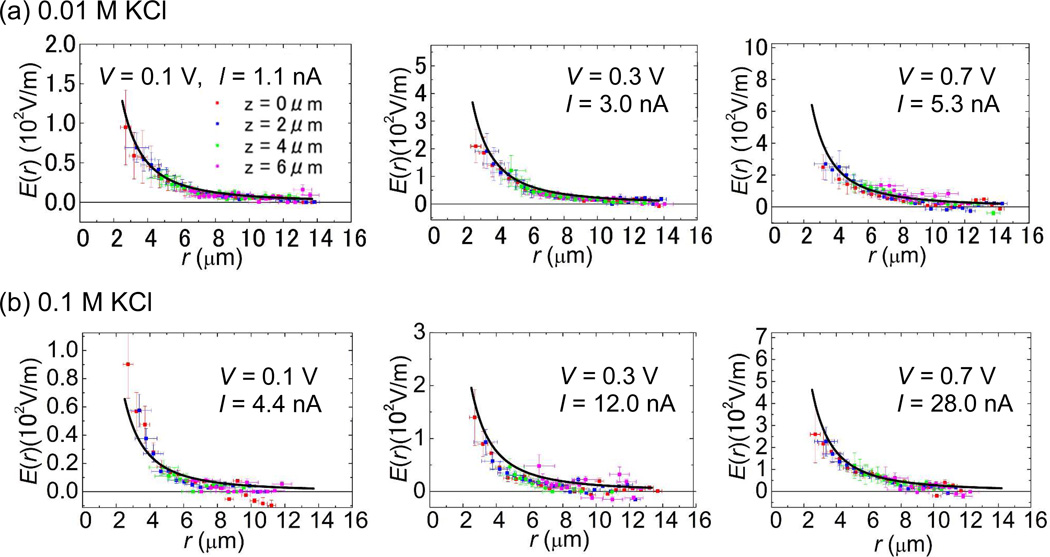
Figure 4.
The strength of the electric field E(r) at bias voltages, 0.1, 0.3 and 0.7 V as a function of r at various heights, 0, 2, 4 and 6 µm from the nanopore membrane surface. The salt concentrations are 0.01M for (a) and 0.1 M KCl for (b). Each solid curve in each graph is plotted based on the simple theoretical model by Ohm’s law in equation (3), E(r) = |J(r)|/σ with the experimentally measured ionic currents through nanopore at given bias voltages. The y axis scales in each Fig. 4 plots are normalized by the proportionality constants, I/2πσ of 1/r2. The same figure was also plotted in the same scale for better comparisons in Figure S2 of the Supporting Information.

