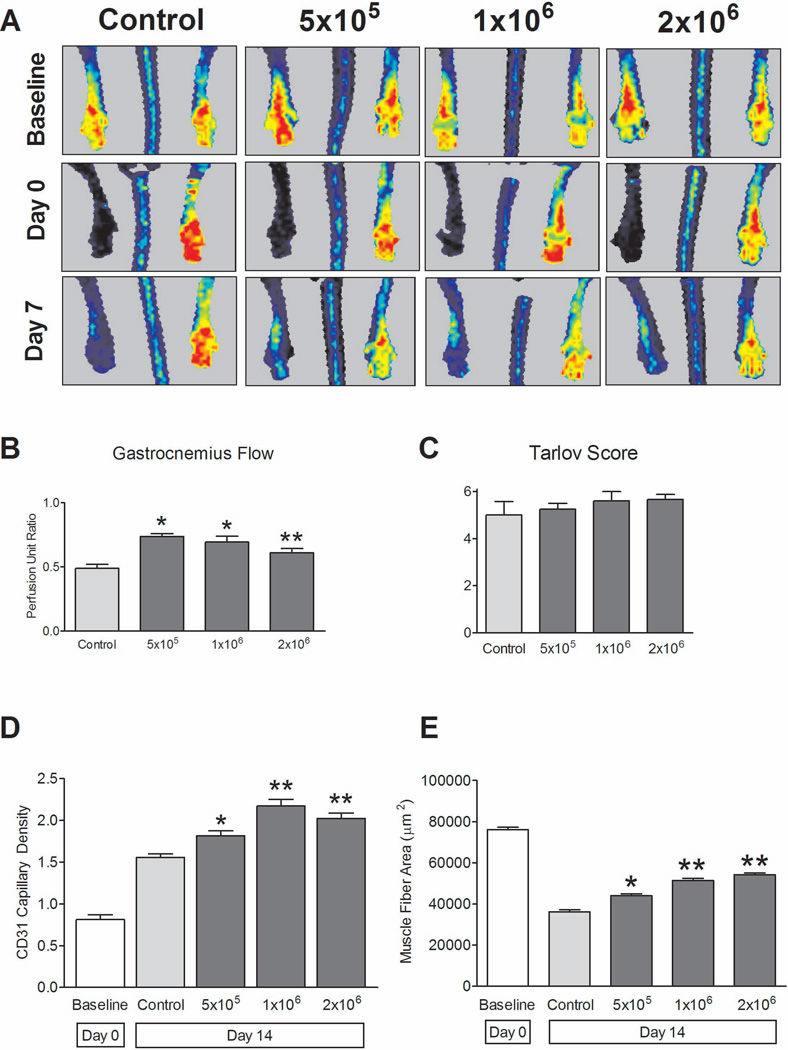
Figure 4.
MNC dose-response. n=4–6 per group. (A) Representative laser Doppler perfusion images; quantification showed no differences between MNC-treated groups at day 7 (P = .7501, ANOVA). (B) MNC-treated mice show increased perfusion (day 7) compared to control mice (P = .0018, ANOVA); 5×10⁵ and 1×10⁶ MNC groups showed increased distal flow versus control (*, P < .05; post-hoc test). **, P > .05 compared to other groups. (C) Functional outcomes: No significant differences between MNC treatment groups and control (P = .5520, ANOVA). (D) Increased capillary density (day 14) in MNC-treated mice compared to control mice (P < .0001, ANOVA). *, P < .05 vs. control, post-hoc test. **, P < .05 vs. control, post-hoc test; P > .05 vs. each other, post-hoc test). n=3. (E) Increased gastrocnemius muscle fiber area (day 14) in MNC-treated mice compared to control mice (P < .0001, ANOVA). *, P < .05 vs. control, post-hoc test. **, P < .05 vs. control, post-hoc test; P > .05 vs. each other, post-hoc test). n=3.

