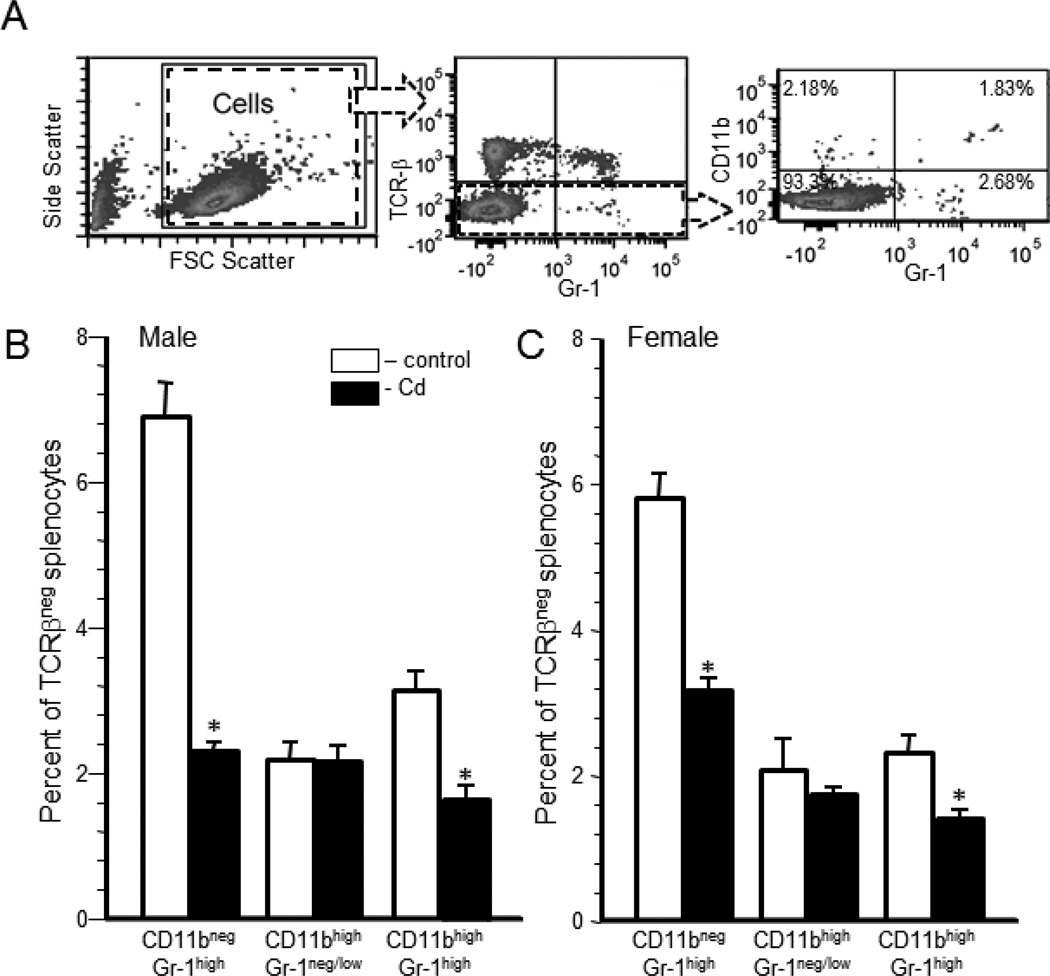
Figure 3. Prenatal Cd exposure changed the relative percentages of granulocyte subpopulations of 20 week-old offspring.
Spleen cells were isolated from male and female mice that were exposed to 10 ppm Cd (solid bars) or water (open bars) and analyzed by flow cytometry as described in the Materials and Methods. Live cells (Figure 3A, left panel) were analyzed for TCR-β expression (Figure 3A, middle panel). The TCR-β negative population was analyzed for CD11b and Gr-1 expression (Figure 3A, right panel). Four populations were determined: CD11bnegGr-1neg/low, CD11bnegGr-1high, CD11bhighGr-1neg/low, and CD11bhighGr-1high. Figure 3A shows a typical set of plots for a Cd-exposed male offspring. The results are shown for males (B) and females (C). The results for the CD11bnegGr-1neg/low (lower left quadrant) are not shown. Each bar represents the mean ± SEM. Data are representative of 2 experiments where the n equals at least 5 in each group. *p<0.05

