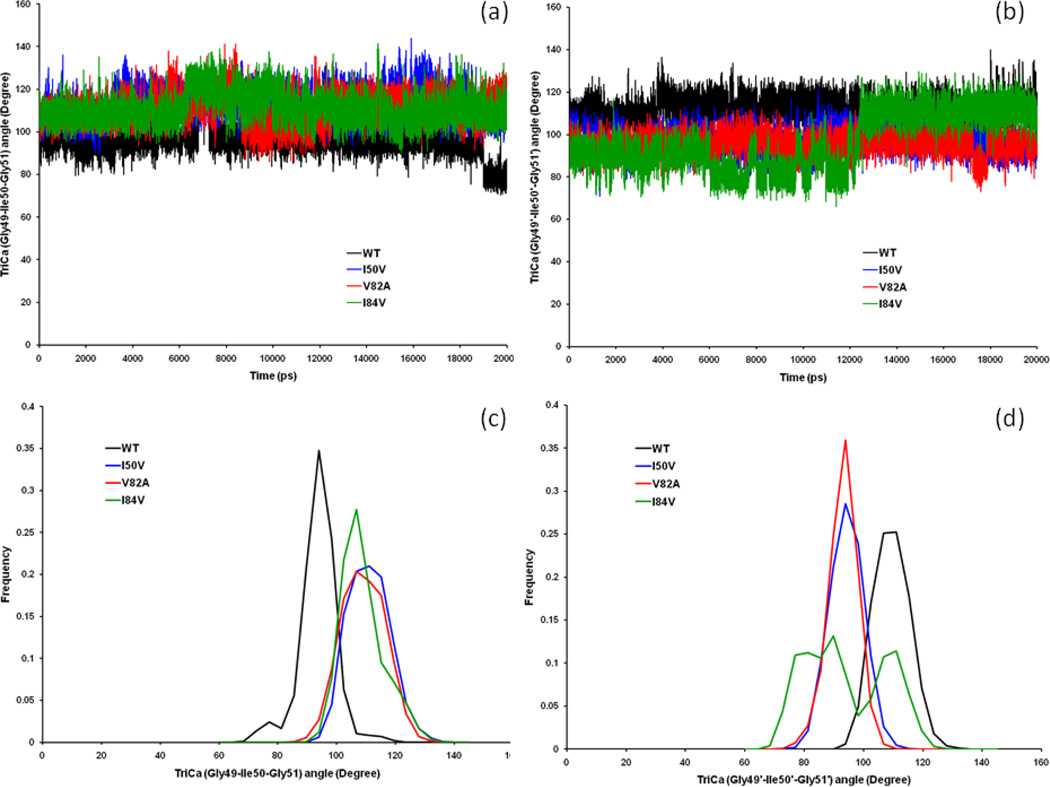
Figure 8.
Time-series plot of (a) the Gly48–Gly49–Ile50 TriCa angles and of (b) the Gly49’–Ile50’–Gly51’ TriCa angles of the CSWNT bound WT, I50VPR, V82APR and I84VPR mutant HIV-PR complexes. Histogram distributions of Gly48–Gly49–Ile50 TriCa angles (c); and of Gly49’–Ile50’–Gly51’ TriCa angles (d) for WT and all mutant HIV-pr simulation of the SWCNT-bound protein.

