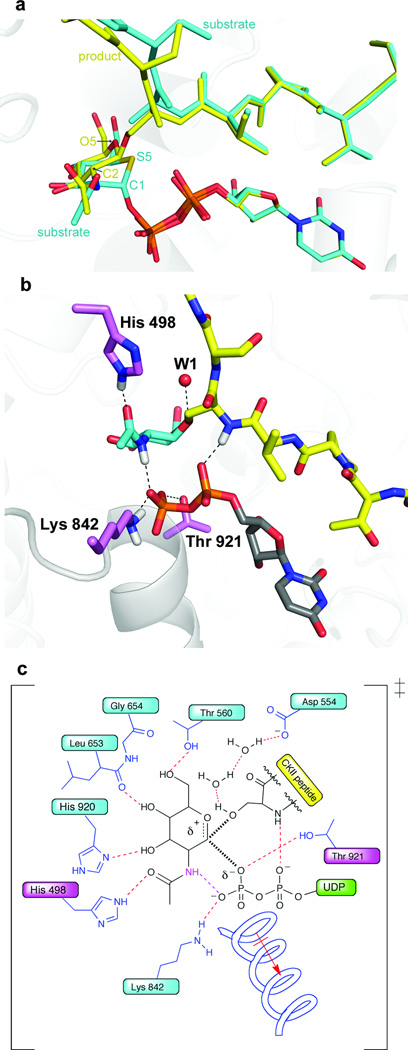
Figure 2. Glycosylation reaction trajectory and interactions facilitate glycosyltransfer.
(a) Overlay of the ternary substrate complex (cyan) and product complex (yellow). (b) Selected interactions in the ternary product complex. Proposed hydrogen bonds are illustrated with a dashed line. The positions of putative hydrogen atoms are shown in white for the His, acetamido group, Lys, and the peptide backbone. New interactions to the phosphate observed only in the product complex are the acetamide interaction and the Thr921 interaction18. An important water molecule that may shuttle away the proton after reaction is shown as W1. (c) Putative transition state schematic. Important interactions to the transition state are indicated, based on an analysis of the substrate and product structures. The partial bonds in the transition state are shown as thick, hashed lines. The new interactions in the product complex that may reflect directly on the late transition state are shown in magenta.

