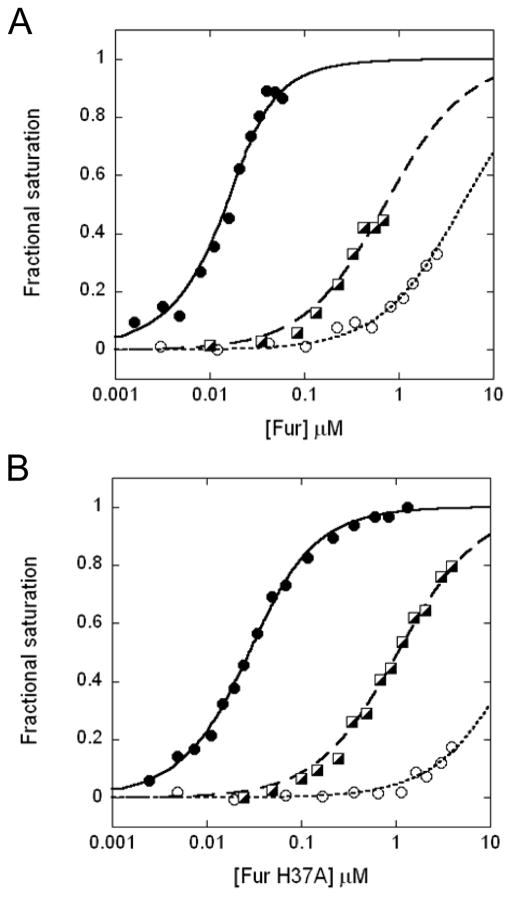
Figure 5.
DNA binding of (A) WT and (B) H37A BsFur. Normalized DNA binding curves of BsFur in presence of saturating Mn(II) conditions (filled circles, solid curve) or 1 mM EDTA (open circles, dotted curve) are shown. The DNA binding of the Fur2Zn2:Zn2 form of both WT and H37A BsFur are also shown (square, dashed curve). Curves represent the best fit with parameters compiled in Table 2.

