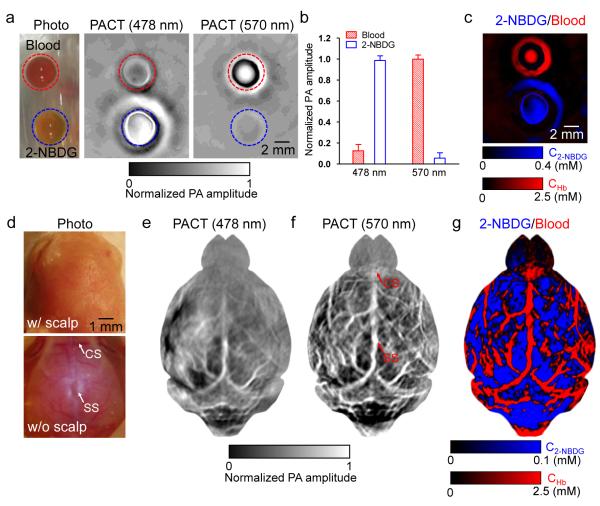
Figure 4.
Multi-wavelength PACT in vitro and in vivo. (a) Photograph (left) and PACT images (middle and right) of whole bovine blood and 0.4 mM 2-NBDG in a gelatin phantom. (b) Averaged PA amplitudes from blood and 2-NBDG, normalized by the PA amplitude of blood at 570 nm. (c) Spectral separation of blood (shown in red) and 2-NBDG (shown in blue). CHb: total hemoglobin concentration; C2-NBDG: 2-NBDG concentration. (d) Photograph of a mouse brain with its scalp intact (top) and removed (bottom). SS: sagittal sinus; CS coronal suture. (e-f) PACT images of the mouse brain at (e) 2-NBDG-dominant 478 nm and (f) hemoglobin-dominant 570 nm, respectively. (g) Spectral separation of blood (shown in red) and 2-NBDG (shown in blue) in the brain.

