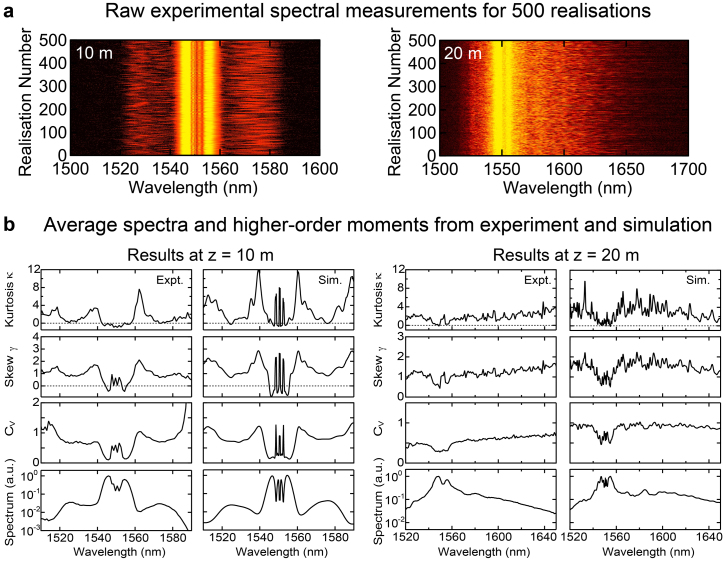
Figure 3.
(a) False colour plot of 500 sequential real time measurements of spectra after 10 m and 20 m propagation.Note that the logarithmic colour scale used highlights the low intensity fluctuations about the pump wavelength regime which is saturated. The shot-to-shot variation in the spectral structure is very apparent. (b) Shows quantitative data over 5000 realisations plotting calculated mean spectra as well as higher order moments of Coefficient of Variation Cv, Skew γ and Kurtosis κ as indicated. At each distance both experimental (Expt) and simulation (Sim) results are shown.

