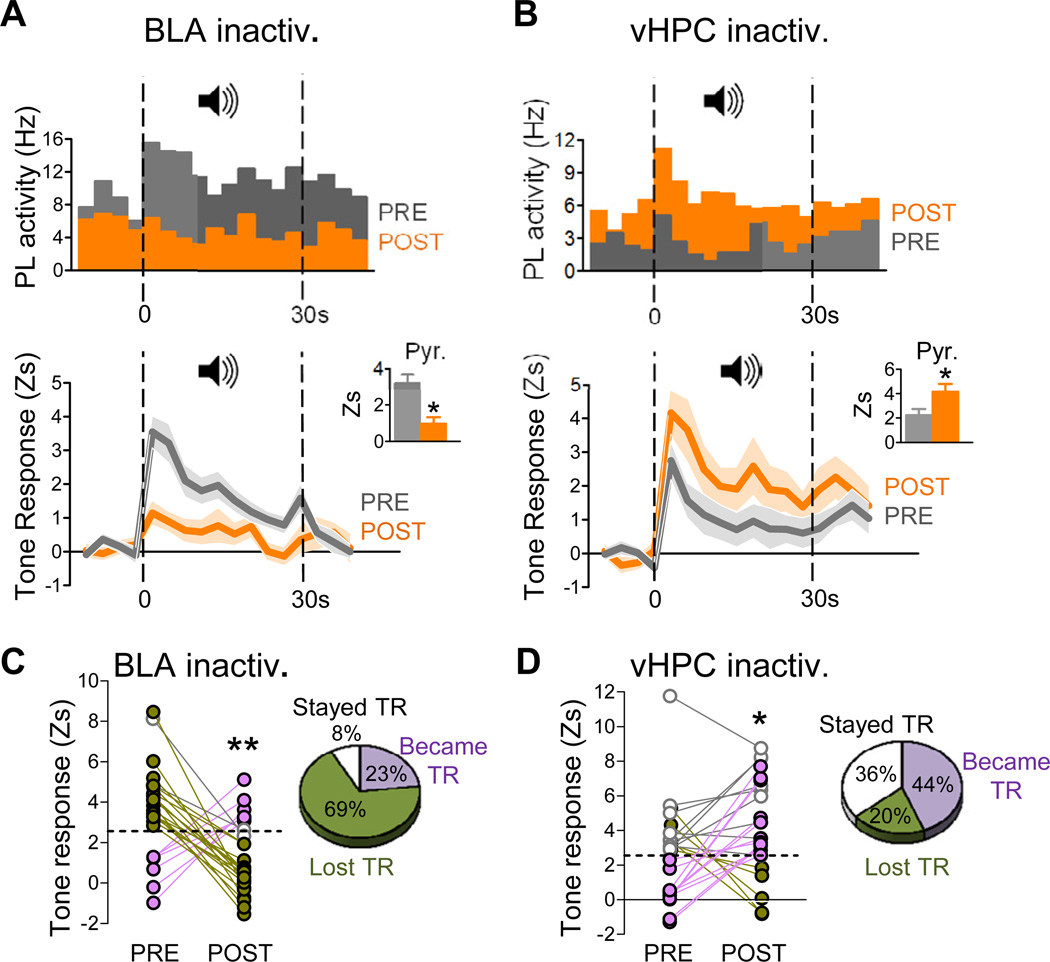
Figure 2. Conditioned tone responses in PL neurons were decreased by BLA inactivation, but increased by vHPC inactivation.
(A) Upper: Peri-event time histogram of a representative PL tone-responsive neuron before (grey) and after (orange) BLA inactivation (bin width = 3 s), showing reduction in tone response with no change in spontaneous activity (Hz; pre-tone). Data represent the average of two conditioned tones before/after input inactivation. Lower: Group data showing that BLA inactivation significantly reduced tone responsiveness of PL neurons, as indicated by z-scores (P<0.001). Data represent averaged conditioned tone presentations over repeated days. Shaded areas represent s.e.m. Inset shows decreased PL tone responses were due in part to decreased pyramidal cell activity.
(B) Upper: Peri-event time histogram of a representative PL neuron that increased its tone response following inactivation of vHPC. Lower: Group data showing that vHPC inactivation significantly increased tone responsiveness of PL neurons, as indicated by z-scores (P<0.05). Inset shows that increased PL tone responses were due to increased pyramidal cell activity.
(C) Line plots tracking the tone responses (TRs) of individual PL neurons classified as significantly tone responsive (Z> 2.58; P<0.01; dotted line) before and/or after inactivation. Pie charts illustrate the percentage of PL neurons that lost TR (green), became TR (purple), or remained TR (white) after inactivation. The majority of PL neurons lost their tone response (green) after BLA inactivation.
(D) In contrast to BLA, inactivation of vHPC caused the majority of PL neurons to maintain their tone response (white) or become tone responsive (purple). *p<0.05; **p<0.01.
See also Figure 2S.

