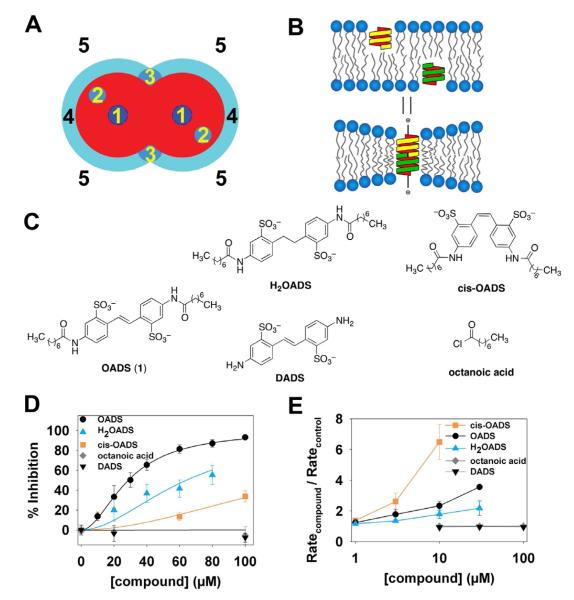
Figure 2. Inhibition of ClC-ec1 by OADS results predominantly from drug-protein interactions.
A) Mechanisms by which drugs can inhibit transporter function: 1) Occluding the transport path to block ion movement; 2) binding to sites formed by the protein, to alter function by altering the free energy difference between different conformations; 3) binding to selective sites at the protein/bilayer interface, which may also alter the bilayer deformation energy contribution to the free energy difference between different conformations; 4) non-specific accumulation at the protein/bilayer interface to alter the local lipid packing and 5) partitioning at the bilayer/solution interface to alter lipid bilayer material properties, which both will alter the bilayer contribution to the membrane protein’s conformational equilibrium (Modified after (Andersen, 2008).
B) Changes in bilayer properties can be determined by measuring changes in the gramicidin (gA) monomer↔dimer equilibrium, e.g., (Lundbaek, et al., 2010) because the hydrophobic length of the bilayer-spanning, ion conducting, dimeric gA channel is less than the hydrophobic length of the host bilayer. gA channel formation therefore leads to a local membrane thinning, with an associated energetic cost that varies with changes in the bilayer properties, thus making gA channels suitable probes for changes in bilayer properties.
C) Panel of OADS derivatives tested for ClC-ec1 potency and bilayer modification: OADS, cis-OADS, and H2OADS, DADS, and octanoic acid.
D) Dose-response curves for inhibition of ClC-ec1 activity by OADS derivatives, as determined by Cl−-efflux assays on liposomes formed from E. coli polar lipids (as in Figure 1B,C.) Each data point represents the mean inhibition ± SEM for 3-5 experiments at each concentration, with the exception of H2OADS points in which represent the average of 2 experiments ± range.
E) Dose-response curves for the OADS derivatives’ effects on bilayer properties, as reported by increases in gA activity. gA activity is determined from the time course of Tl+-induced quenching of a fluorophore encapsulated in gA-doped large unilamellar liposomes (see Experimental Procedures for more details). The quench rate in the presence of a compound normalized to the rate in the absence of added compound reflects the degree of bilayer modification (Ingolfsson and Andersen, 2010)

