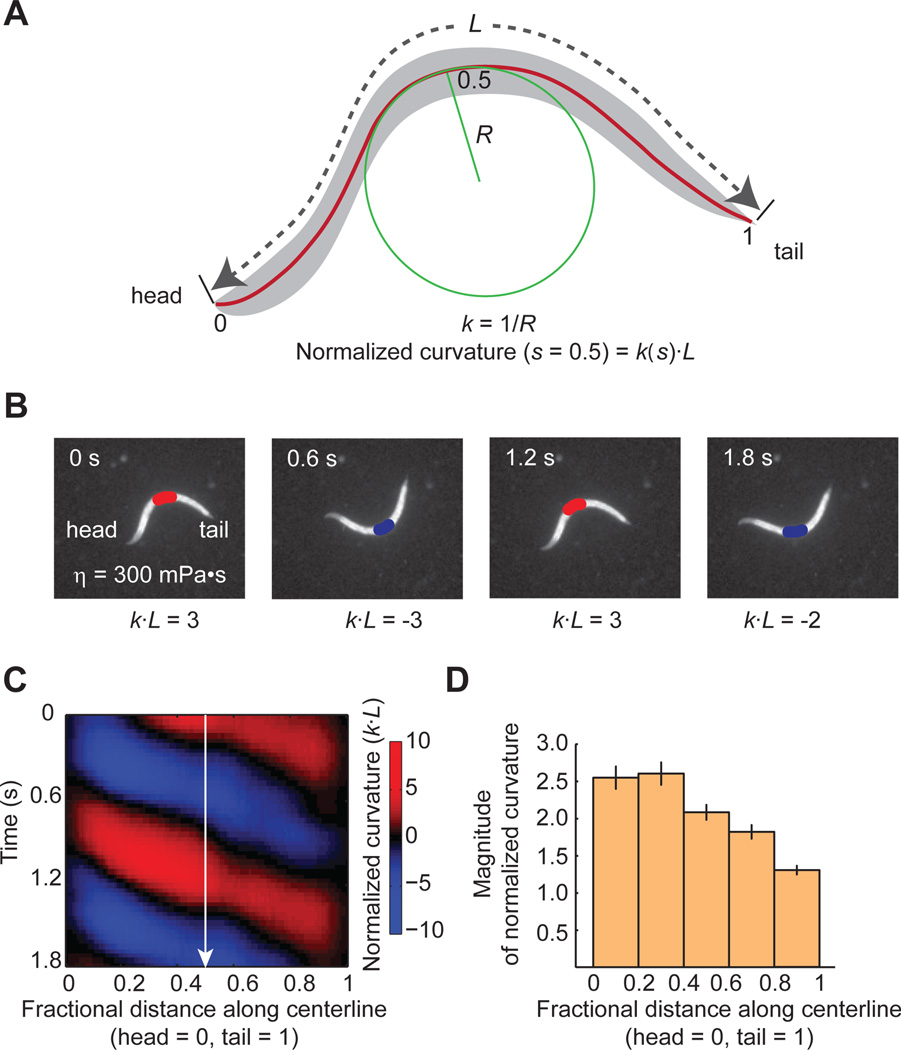
Figure 2. Quantification of undulatory dynamics.
(A) Worm undulatory dynamics is quantified using time-varying curvature along the body. Points along the centerline of length L can be specified in terms of fractional distance from the head (head = 0; tail = 1). The radius of curvature R can be measured at all points along the body. Curvature, κ, is the reciprocal of R. To represent bending in non-dimensional units, we calculate a normalized curvature as κ multiplied by worm length L.
(B) Video images of a worm swimming forward. A red-blue colormap illustrates alternating curvatures at fractional distance = 0.5.
(C) Kymogram of time-varying curvature illustrating retrograde bending waves along the worm represented in non-dimensional units.
(D) Bending magnitude along the body of a wild-type freely swimming worm, measured as the standard deviation of normalized curvature over time. n = 18 worms, mean ± SEM.

