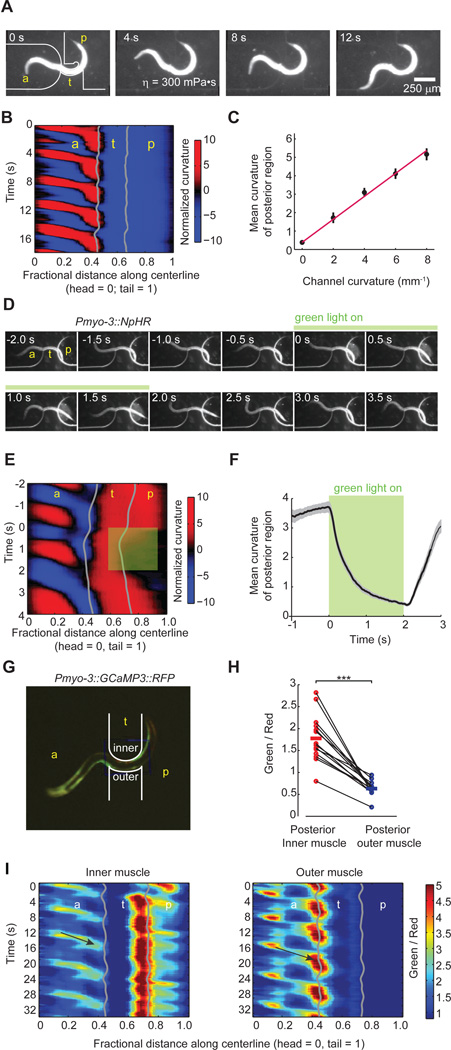
Figure 4. Bending of posterior regions is positively correlated with anterior bending.
(A) Video images of a worm exhibiting forward undulatory gait while partially constrained in a curved microfluidic channel (also see Movie S3).
(B) Kymogram of normalized curvature of the worm shown in (A). Gray lines show anterior and posterior limits of the curved channel.
(C) The curvature of the unrestrained posterior body region, measured as a spatial average from the posterior limit of the channel to the tail and a temporal average over bouts of forward movement, is plotted as a function of channel curvature. Each data point (mean ± SEM) represents data from at least 8 animals. Magenta line is the linear least square fit.
(D) Video images of a transgenic worm (Pmyo-3::NpHR) partially constrained in a curved microfluidic channel. The green bar indicates a 2 s interval during which the posterior body wall muscles emerging from the channel was hyperpolarized by green light illumination (also see Movie S4).
(E) Kymogram of normalized curvature of the animal shown in (D). Green shading indicates the body region and duration of green light illumination.
(F) Mean curvature ± SEM of the posterior region emerging from the curved channels as shown in (D) during green light illumination (~ 30 measurements using 6 worms).
(G) Calcium imaging of body wall muscles in a partially constrained transgenic worm (Pmyo-3::GCaMP3::RFP) in a curved channel. Red fluorescence from RFP constitutes the reference signal. Green fluorescence from GCaMP3 indicates intracellular calcium levels. The contours of the microfluidic channel are drawn in white (also see Movie S5).
(H) Comparison of the ratio of green fluorescence to red fluorescence intensity emitted from inner and outer muscles of the posterior body region. Each data point represents a spatial average of the ratio over a posterior body region (~ 0.2 worm length) adjacent to the channel and a temporal average over a bout of forward movement. Solid lines indicate population mean. Among 14 measurements from 6 worms, six measurements restrict dorsal muscles on the inner side. ***P < 0.001, Wilcoxon signed rank test.
(I) Representative ratiometric kymogram of calcium levels in inner and outer muscle cells of a worm trapped in the device shown in (G). Higher/lower ratios of green fluorescence to red fluorescence in each set of body wall muscles indicate higher/lower intracellular calcium levels. Arrows highlight one calcium wave that propagates from the head to the anterior limit of the curved channel along the inner musculature and outer musculature.

