FIGURE 12. 2D versus 3D CTC measurement of an elongated polyp.
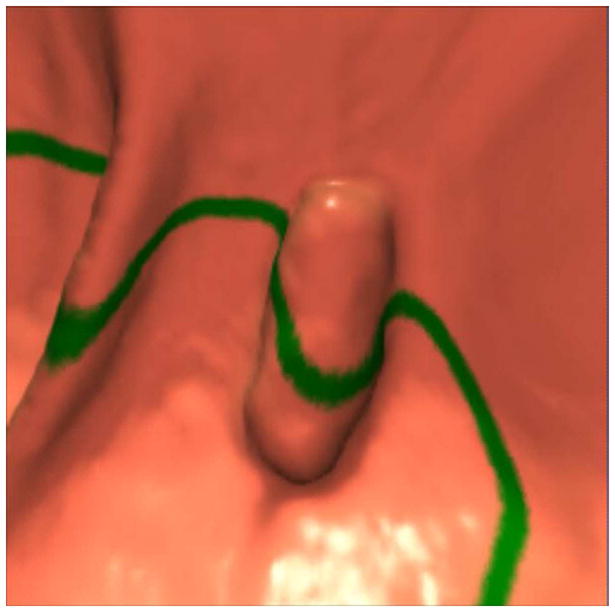
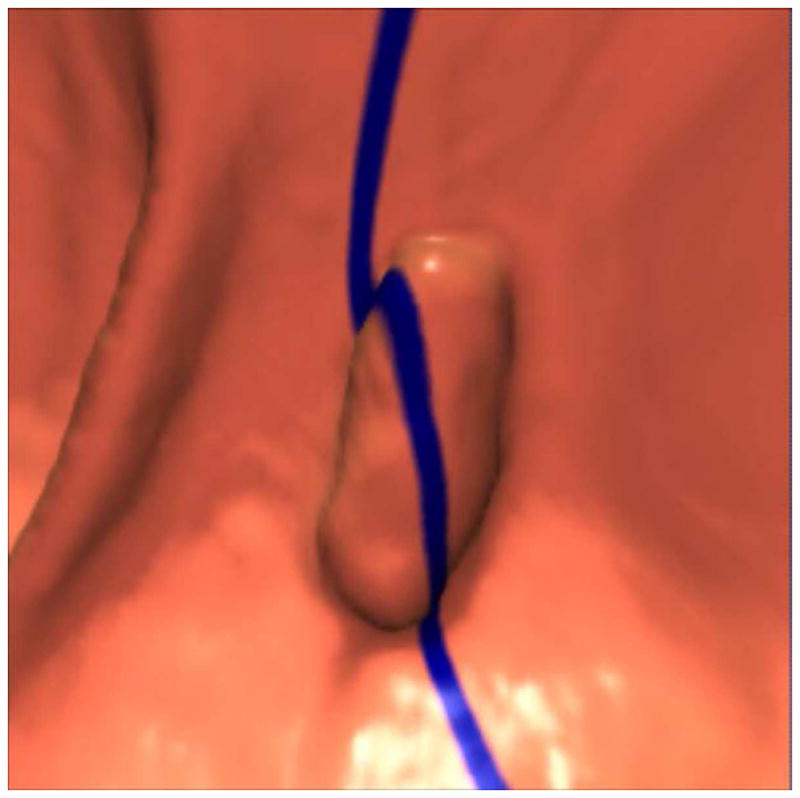
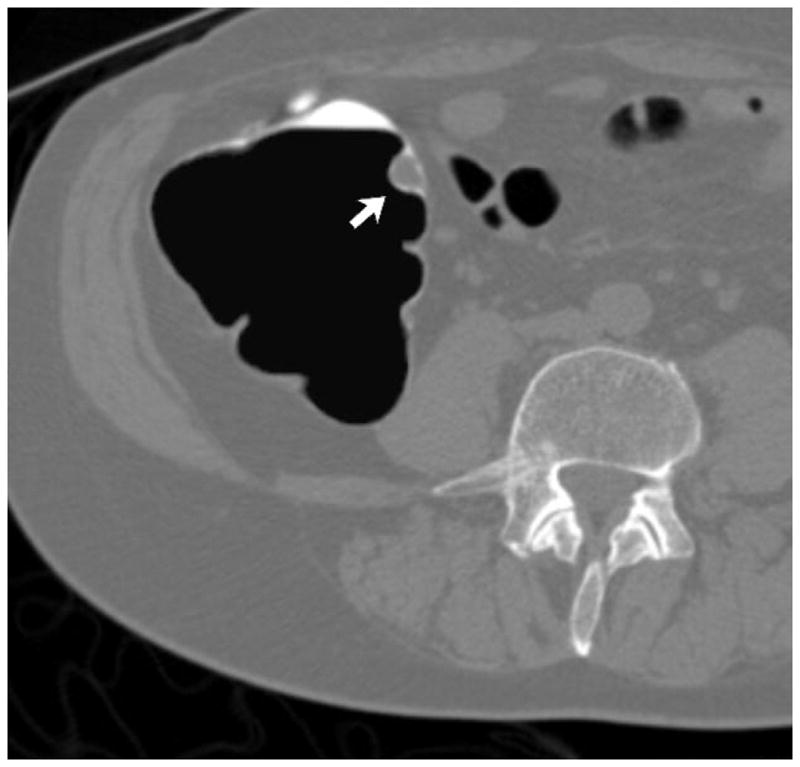
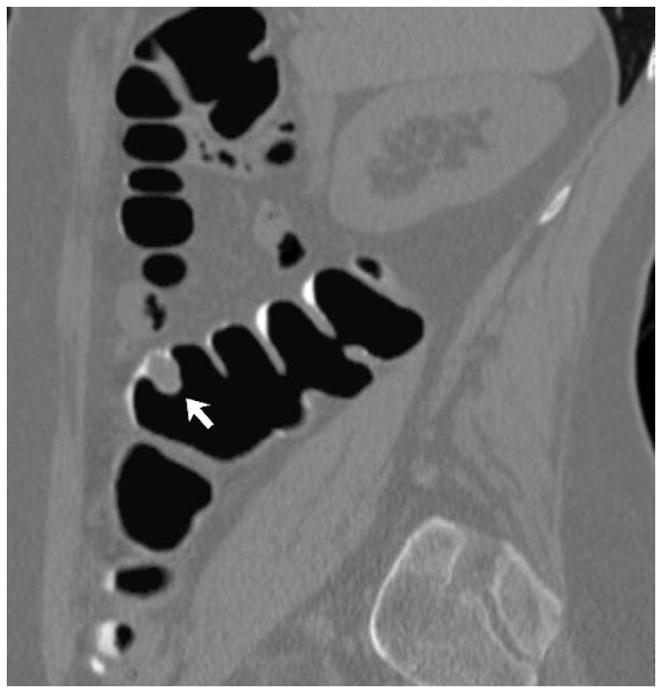
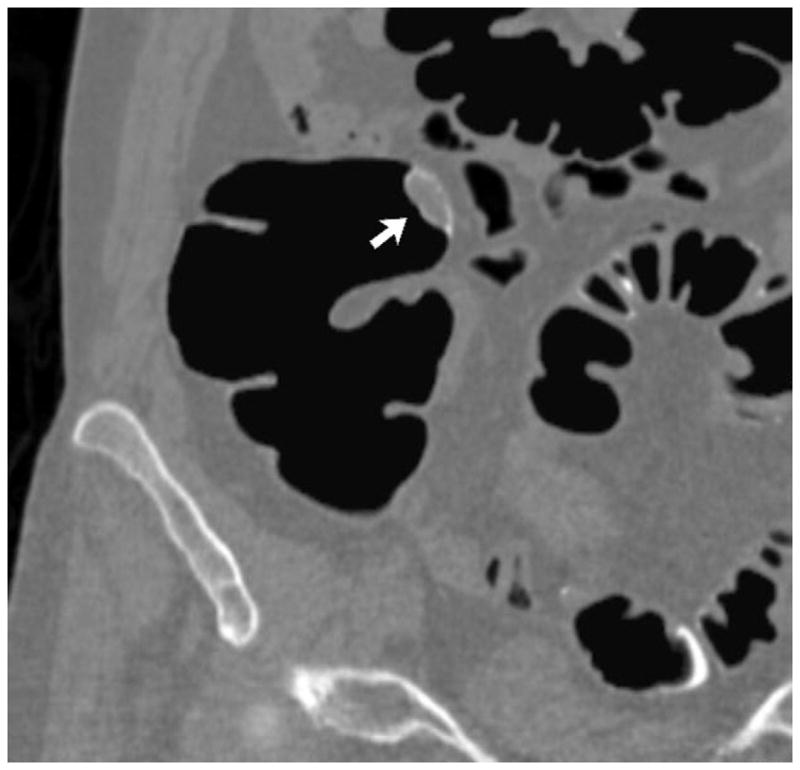
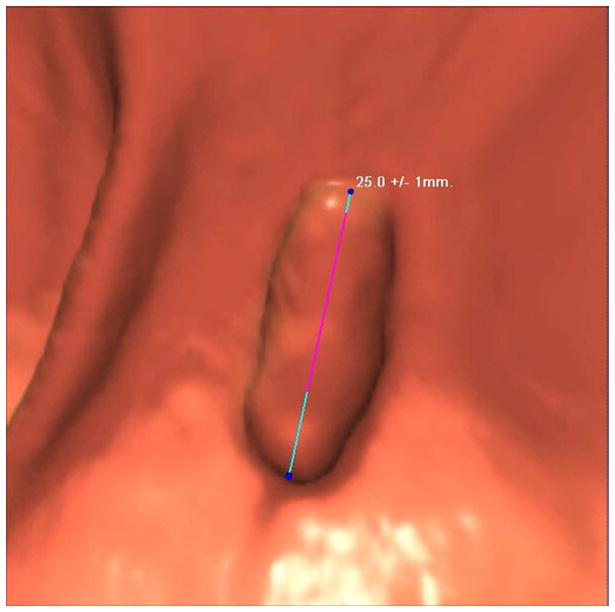
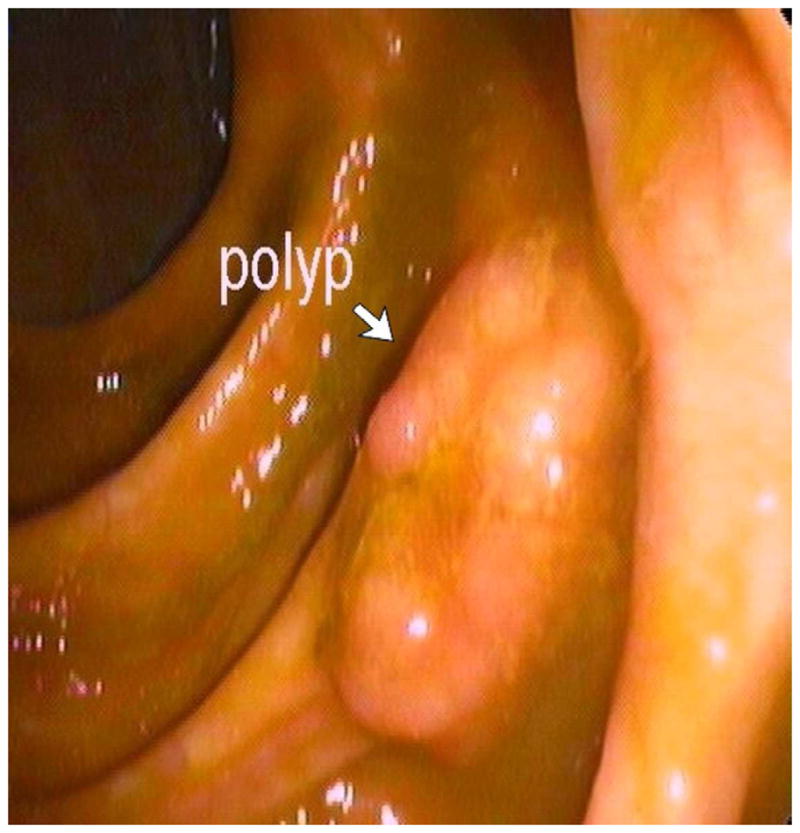
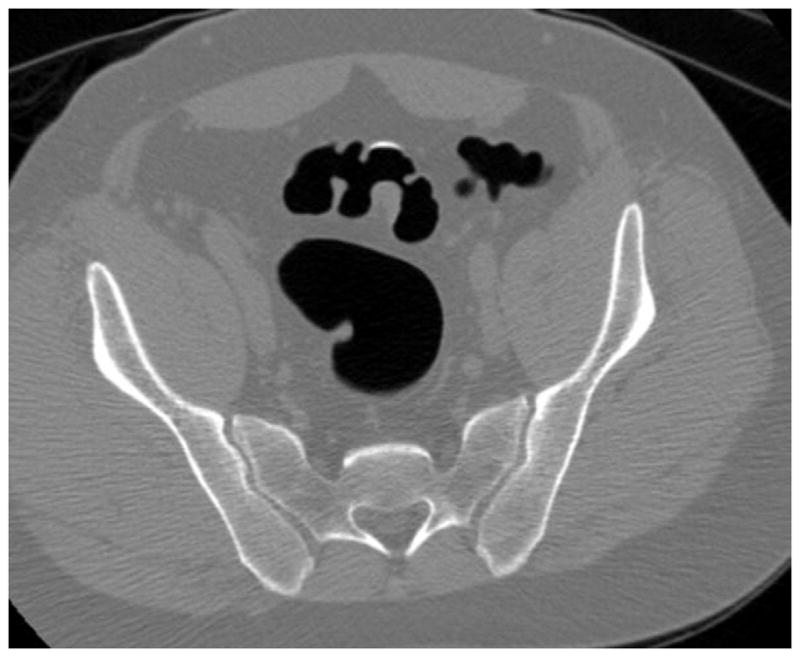
3D endoluminal CTC images (A–C) show an elongated polyp with the transverse (A), sagittal (B), and coronal (C) 2D planes as colored lines through the polyp, corresponding to the 2D transverse (D), sagittal (E), and coronal (F) images (arrows). Even with the “optimized” coronal 2D measurement (C and F), the polyp is significantly undersized, whereas the 3D measurement (G) corresponds to the actual long axis of the polyp, and correlated best with OC (H).
(From reference 5, with permission)
