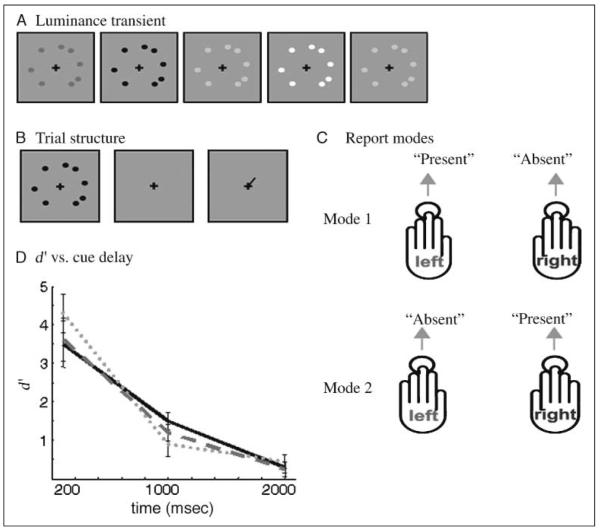
Figure 1.
(A) Schematic depiction of a disc array defined by a 200-msec duration luminance transient. (B) Depicts the basic structure of a trial. Following the cueing stage, the subject makes their response. (C) Depicts the two response modes, each used to answer the same question of whether the disc was present or absent at the cued location. (D) Plot of the variation in d′ as a function of cue delay, acquired during fMRI data acquisition. Gray dots, gray bars, and a black solid line indicate Subjects 1, 2, and 3, respectively. Error bars depict SEM across stimulus position.

