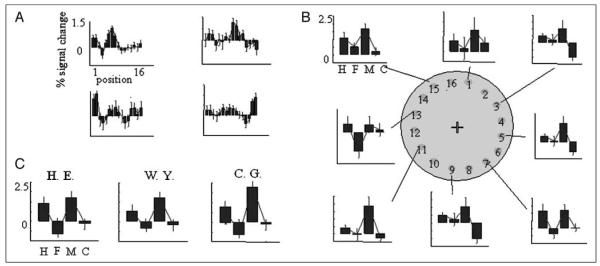
Figure 2.
(A) Shows position selectivity for different loci in V1/V2. Criteria for V1/V2 loci are the most significant voxel for the simple main effect for a single uncued stimulus position. The figure depicts four voxels for illustration, one taken from each quadrant of retinotopic space. Plots show parameter estimates for all 16 stimulus positions for Subject H. E. (B) Upper: Graphs display signal detection profiles for each V1 loci (and therefore stimulus position) plotted around a depiction of stimulus space (odd-numbered positions only for figure clarity). (C) The average of all of these loci is plotted for each subject. For B and C, H = hits; F = false alarms; M = misses; C = correct rejections.

