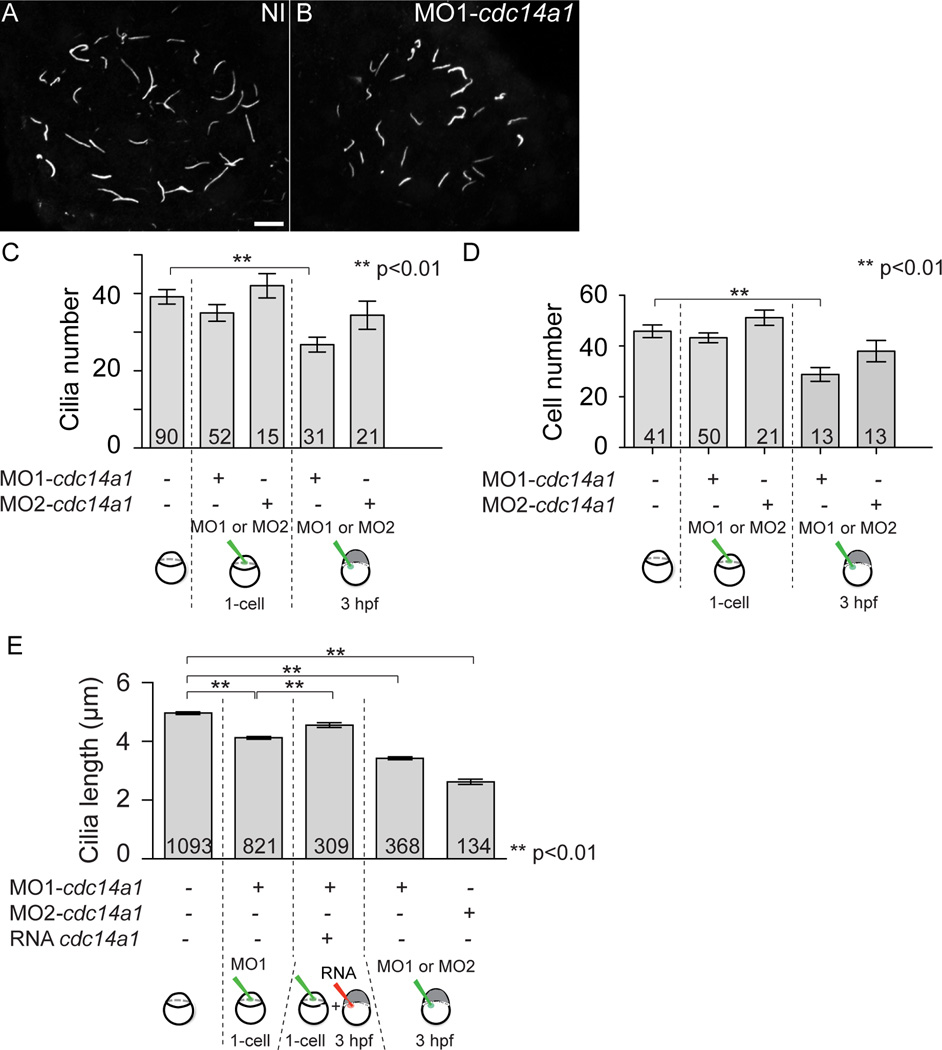
Figure 4. Effect of Cdc14A1 in KV ciliogenesis.
A,B: Cilia in the KV at 14 hpf visualized with an anti-acetylated-tubulin antibody. Scale bar represents 10 µm. C: Cilia number was determined at 14 hpf. D: The number of cells in the KV was determined at 14 hpf. E: Cilia length was measured at 14 hpf. The numbers of embryos (C,D) and cilia (E) analyzed are indicated. Data are represented as mean ± SEM. Statistics were done using Student’s t-Test and calculated against the non-injected sample.

