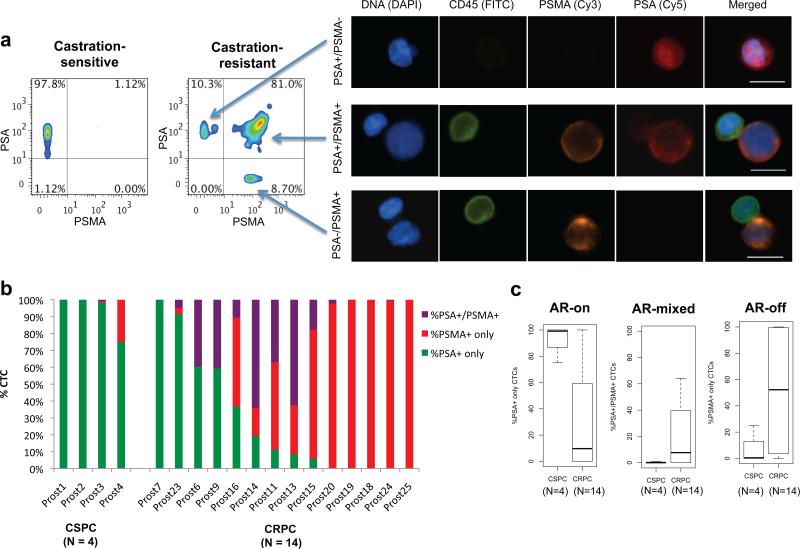
Figure 2.
Single cell measurements of AR signaling identify predominantly AR-on CTCs in castration-sensitive prostate cancer versus heterogeneous signatures in castration-resistant prostate cancer. (a) Pseudocolor density plots of multiparameter immunofluorescence profiles of CTCs from patient with castration-sensitive prostate cancer (left panel) and castration-resistant prostate cancer (right panel). X- and y- axes represent “area-pixel” single cell signal intensity measurements for PSMA and PSA, respectively. Representative images are depicted of an “AR-on” (PSA+/PSMA-) CTC (top row on right), an “AR-mixed” (PSA+/PSMA+) CTC (middle row), and an “AR-off” (PSA-/PSMA+) CTC (bottom row), with CD45 (FITC), PSMA (Cy3), and PSA (Cy5). Contaminating CD45+ leukocytes are depicted for comparison in the middle and bottom rows. Scale bars, 10 μm. (b) Bar graphs showing proportional distribution of AR signaling phenotypes in CTCs from patients with CSPC or CRPC prior to initiation of therapy. Patient samples are ordered according to relative percentage of “AR-on” %PSA+ only CTCs. (c) Box plots demonstrating the relative proportions of AR signaling phenotypes in CTCs from patients with CSPC compared to CRPC prior to initiation of therapy (P = 0.012 for %PSA+/PSMA-; P = 0.071 for %PSA+/PSMA+; P = 0.076 for %PSA-/PSMA+).

