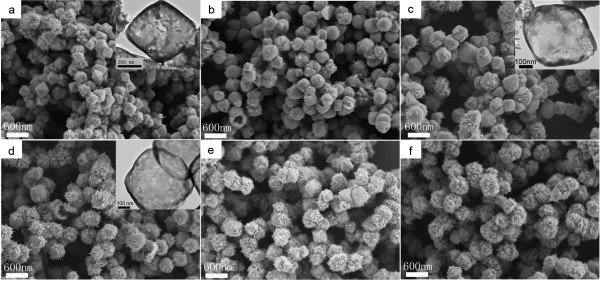
Figure 4.
SEM images of Cu2O samples obtained with different concentrations of EDA. The concentrations of NaOH solution is 0.1 mol L−1 and the concentrations of EDA were as follows: (a) 40 μL (EDA)/24 mL (total solution) (SI1-C1 in Additional file 1), (b) 70 μL/24 mL (SI1-C2 in Additional file 1), (c) 100 μL/24 mL (SI1-C3 in Additional file 1), (d) 150 μL/24 mL (SI1-C4 in Additional file 1), (e) 200 μL/24 mL (SI1-C5 in Additional file 1), (f) 300 μL/24 mL (SI1-C6 in Additional file 1). The inset in SEM is the corresponding TEM morphology of the Cu2O crystal.

