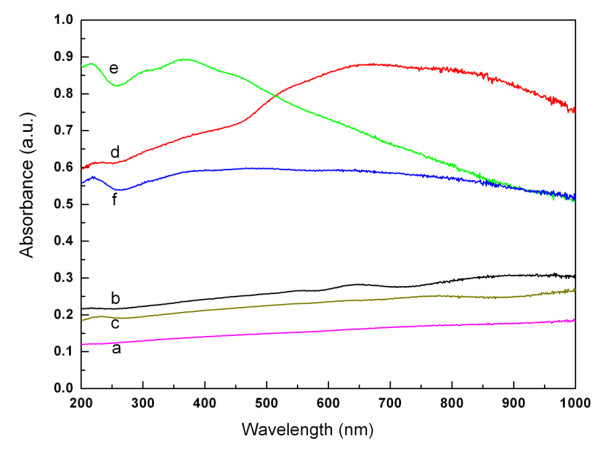
Figure 7.

UV–vis absorption spectra and plots of absorbance versus absorption and irridiation time. (A,C) Absorption and photodegradation spectrum of a solution of methyl orange (A) and congo red (C) in the presence of the hollow octahedral Cu2O sample shown in Figure1c. (B,D) Plots of absorbance versus absorption time (0 to 120 min) and irradiation time (20 min, 40 min, 60 min) for methyl orange (B) and congo red (D) in the presence of different Cu2O samples: (a), solid octahedral Cu2O shown in Figure 3a; (b), hollow sphere Cu2O shown in Figure 1a; (c), hollow octahedral Cu2O (SI1-D3 in Additional file 1); (d), hollow octahedral Cu2O shown in Figure 3b; (e), hollow octahedral Cu2O shown in Figure. 1b; (f), hollow sphere Cu2O shown in Figure 4d. Analytical grade TiO2 reagent (100 nm, anatase phase).
