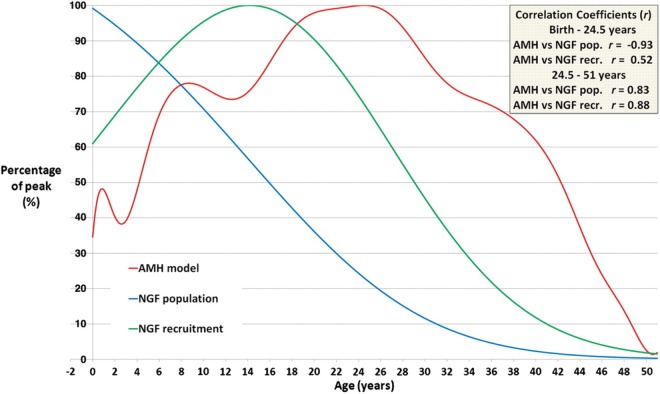
Figure 4.
Comparison of serum AMH concentrations with NGF population and with NGF recruitment. The red line is the log-unadjusted validated AMH model (Kelsey et al., 2012), peaking at 24.5 years. The blue line denotes the decline in NGF population (Wallace and Kelsey, 2010), with peak population at 18–22 weeks gestation. The green line denotes the numbers of NGFs recruited towards maturation population (Wallace and Kelsey, 2010), with peak numbers lost at age 14.2 years on average. Each quantity has been normalized so that the peak occurs at 100%. Correlation coefficients (r) are given for AMH concentrations against the other two curves for birth to 24.5 years and for 24.5–51 years. Reproduced with permission from Kelsey et al. (2012).

