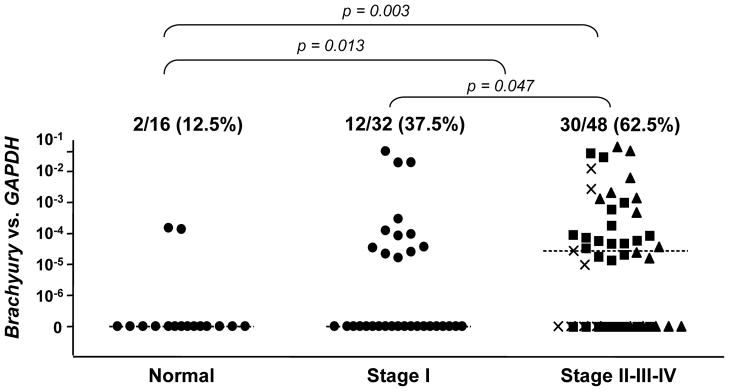
Figure 4. Brachyury expression in human lung tumor tissues.
Real-time PCR was performed for Brachyury on lung tumor tissue cDNA from 80 lung cancer patients of the indicated stages of disease. The Stage II, III, and IV cDNA samples are further represented by the symbols ν, σ, and ×, respectively. As controls, 16 samples of normal lung cDNA were also analyzed, each obtained from a pathologically normal section of lung from a cancer patient. All values and the medians for each group are expressed as a ratio to the endogenous control GAPDH. Reproduced with permission from the American Society for Clinical Investigation; see reference 49.

