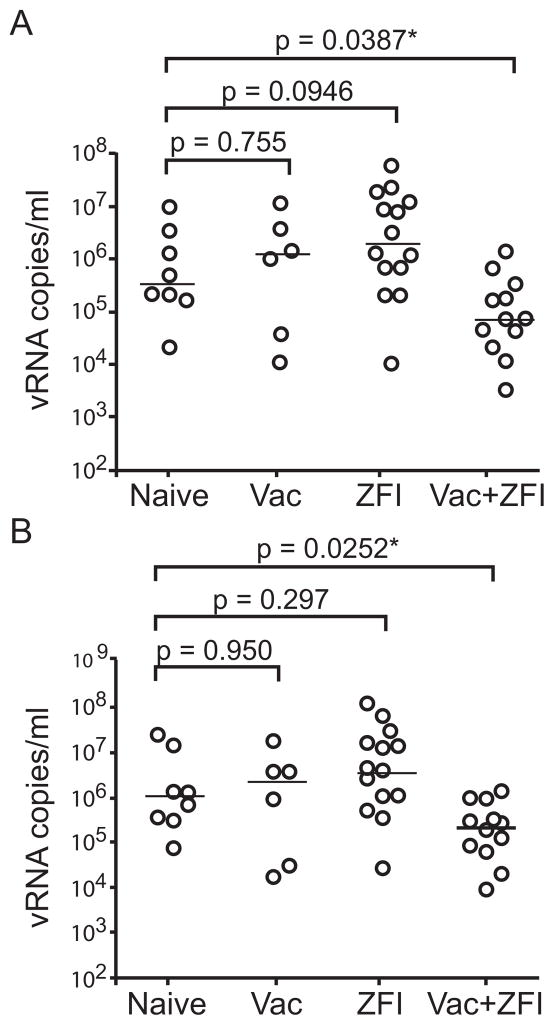
Figure 2. Plasma virus levels in infected macaques.
(A) Peak acute viremia after infection with SHIVSF162P3. A scatter plot comparison of the peak plasma virus replication in vaccinated, ZFI-treated, combination and their naïve controls. (B) SHIV levels during the first 20 weeks of infection with SHIVSF162P3. A scatter plot comparison of the area under the curve (AUC) viremia in vaccinated, ZFI-treated, combination and their naïve controls during 20 weeks of infection. The line represents the median of each group. * highlights p values that are statistically significant.

