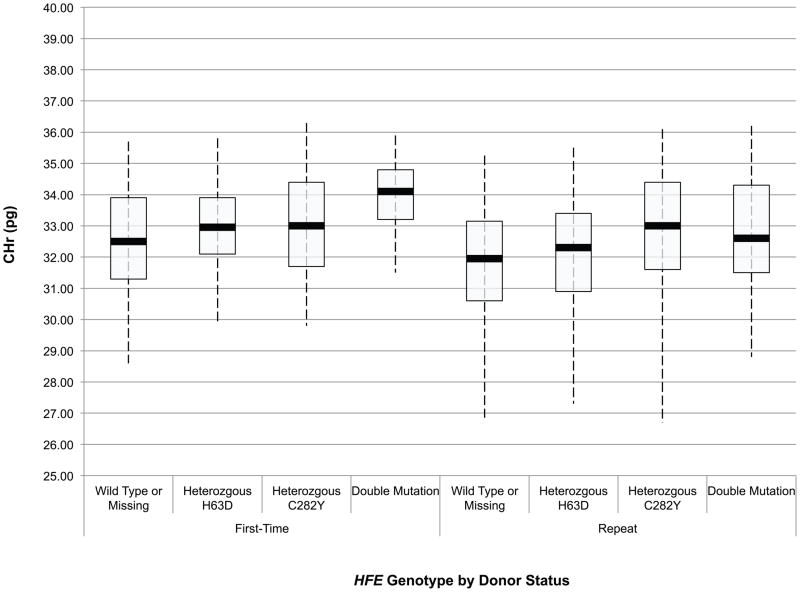
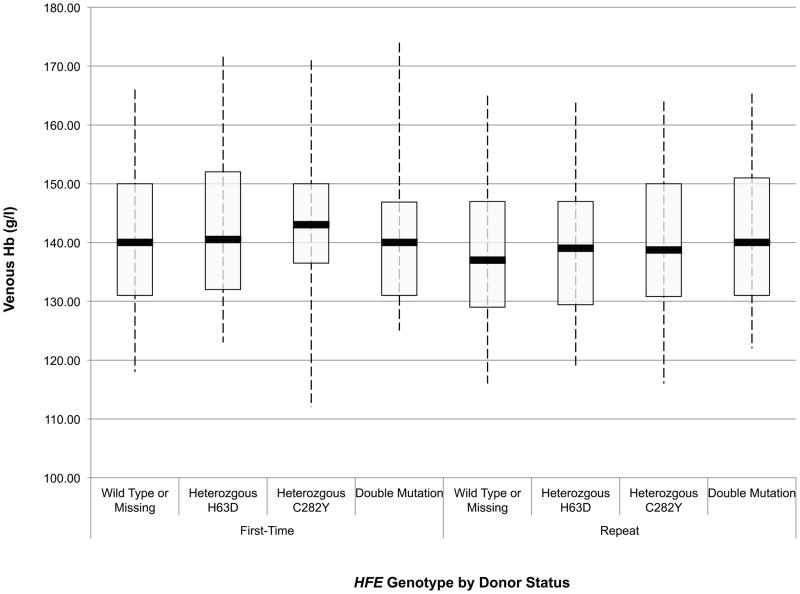
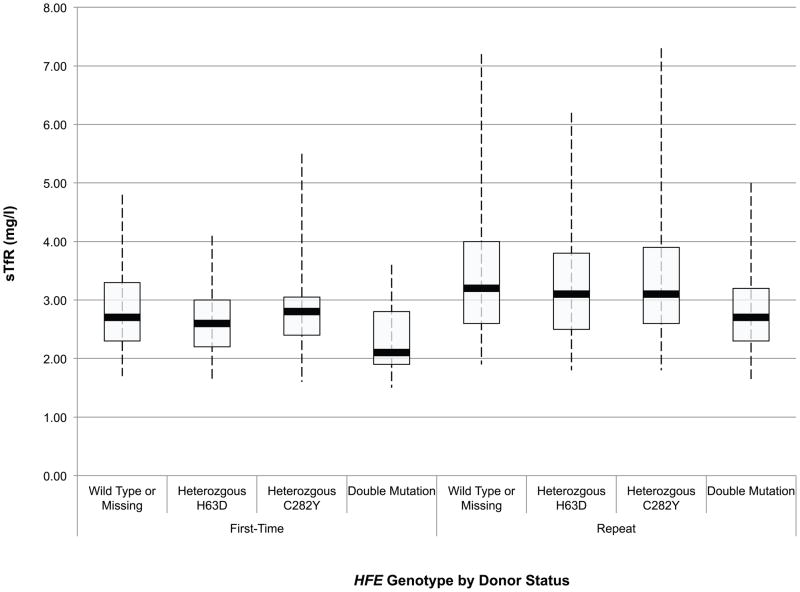
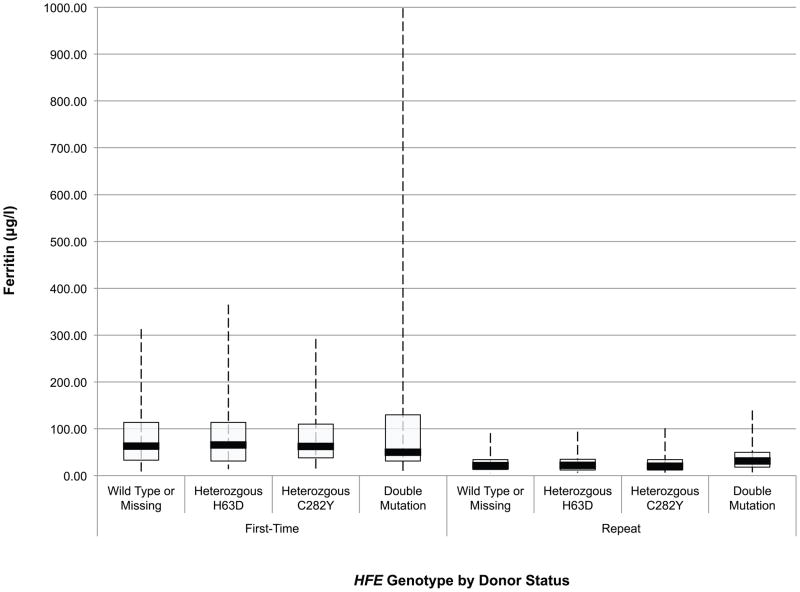
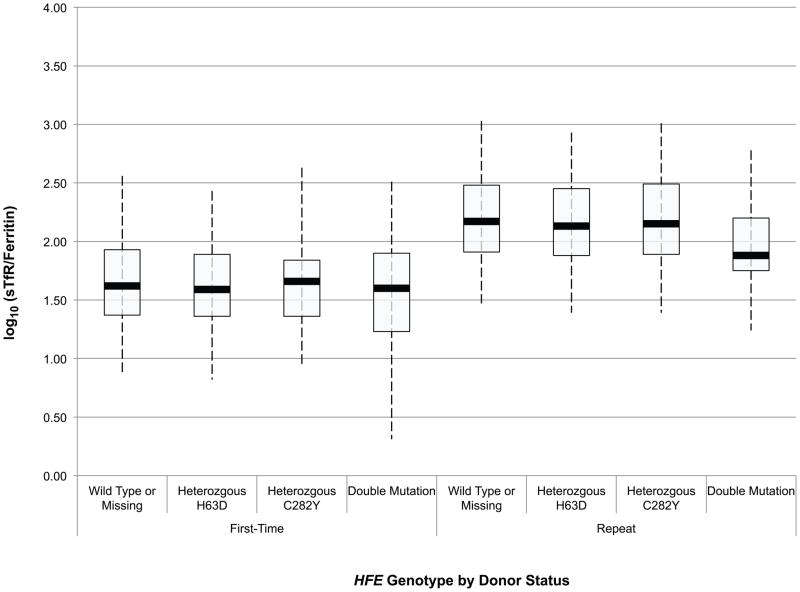
Fig 1.
Box and whisker graphs comparing haemoglobin and iron parameters in first time/reactivated and frequent donors grouped by HFE genotype at baseline. The boxes stretch from the 25th to the 75th percentile. Median values are indicated by the horizontal line across the box. The whiskers stretch to the 5th and 95th percentile. A) CHr; B) venous haemoglobin; C) sTfR; D) ferritin; E) log(sTfR/ferritin).

